

July 26, 2022 •Nathan Willis

“THE STOCK MARKET HAS PREDICATED 9 OF THE PAST 5 RECESSIONS.”
-Paul Samuelson, Nobel Prize winning economist
Market Review Q2 2022
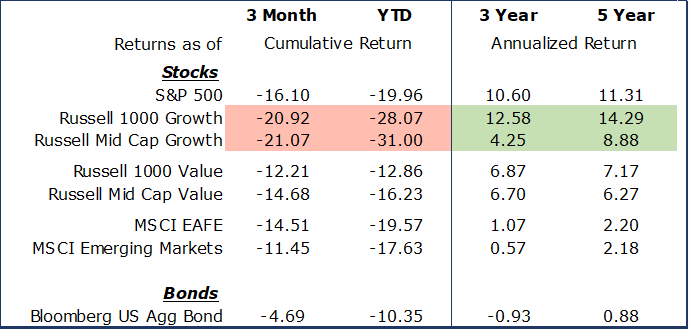
Stocks continued to slide in the second quarter as fears of inflation have morphed into fears of a Fed-induced recession.
- This caused growth stocks to sell off in the first quarter, a trend which continued in the second.
- This is a significant reversal relative to the last several years where performance has been dominated by growth investments.
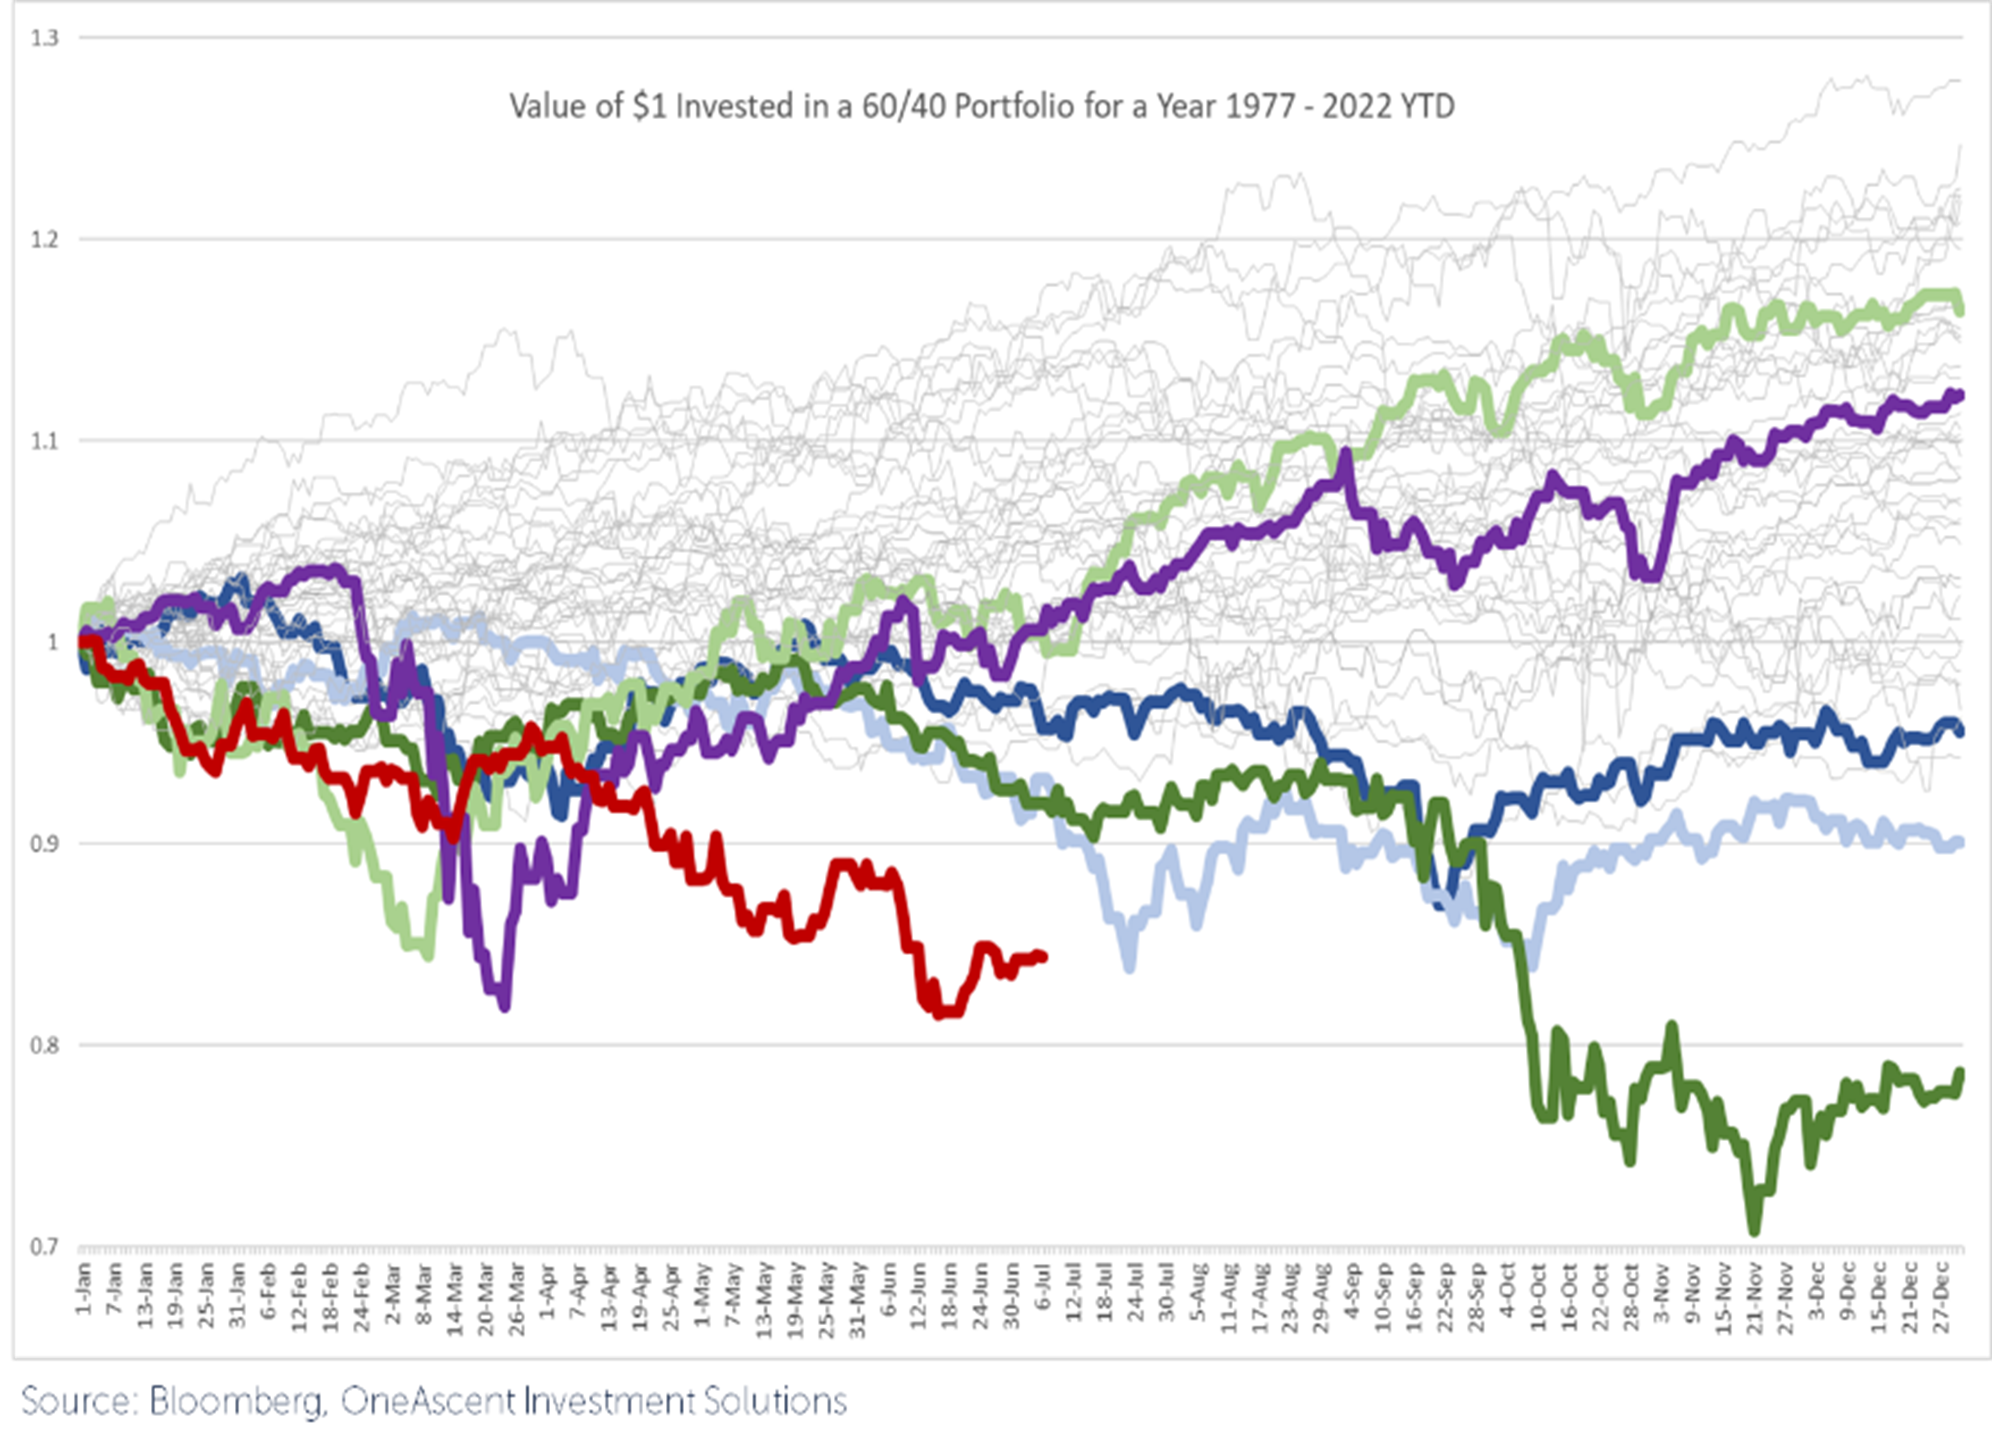 Bonds also continued to decline in the second quarter, ending with double digit losses. This resulted in the worst start for balanced portfolios since the Great Depression.[1] The chart to the left illustrates the magnitude of the 2022 decline for a 60% stock, 40% bond portfolio (in red) relative to history, showing the portfolio moving along its path of returns throughout the year. We compare 2022 to recent crisis periods such as the COVID-19 pandemic in 2020 (purple), the Global Financial Crisis of 2008 and 2009 (dark and light green), and the bursting of the tech bubble in 2001 and 2002 (dark and light blue).
Knowing that we’ve had a worse start than these three economic crises can be demoralizing. However, we need to consider what history tells us about the outlook for market returns after such difficult times and what that might mean for the coming months and years. We also need to give considerable attention to the two main worries in the investment markets: the outlook for inflation and the potential of a recession.
In order to frame our outlook, we ask and answer these questions: What happens when things stop getting worse? Have the markets experienced their worst losses? Is inflation still accelerating? Are we at risk of—or are we already in—a recession?
Market outlook – it’s always darkest before the dawn
First, we need to consider what happens when the market stops dipping. What do I mean by that? There are many measures, but here are some examples:
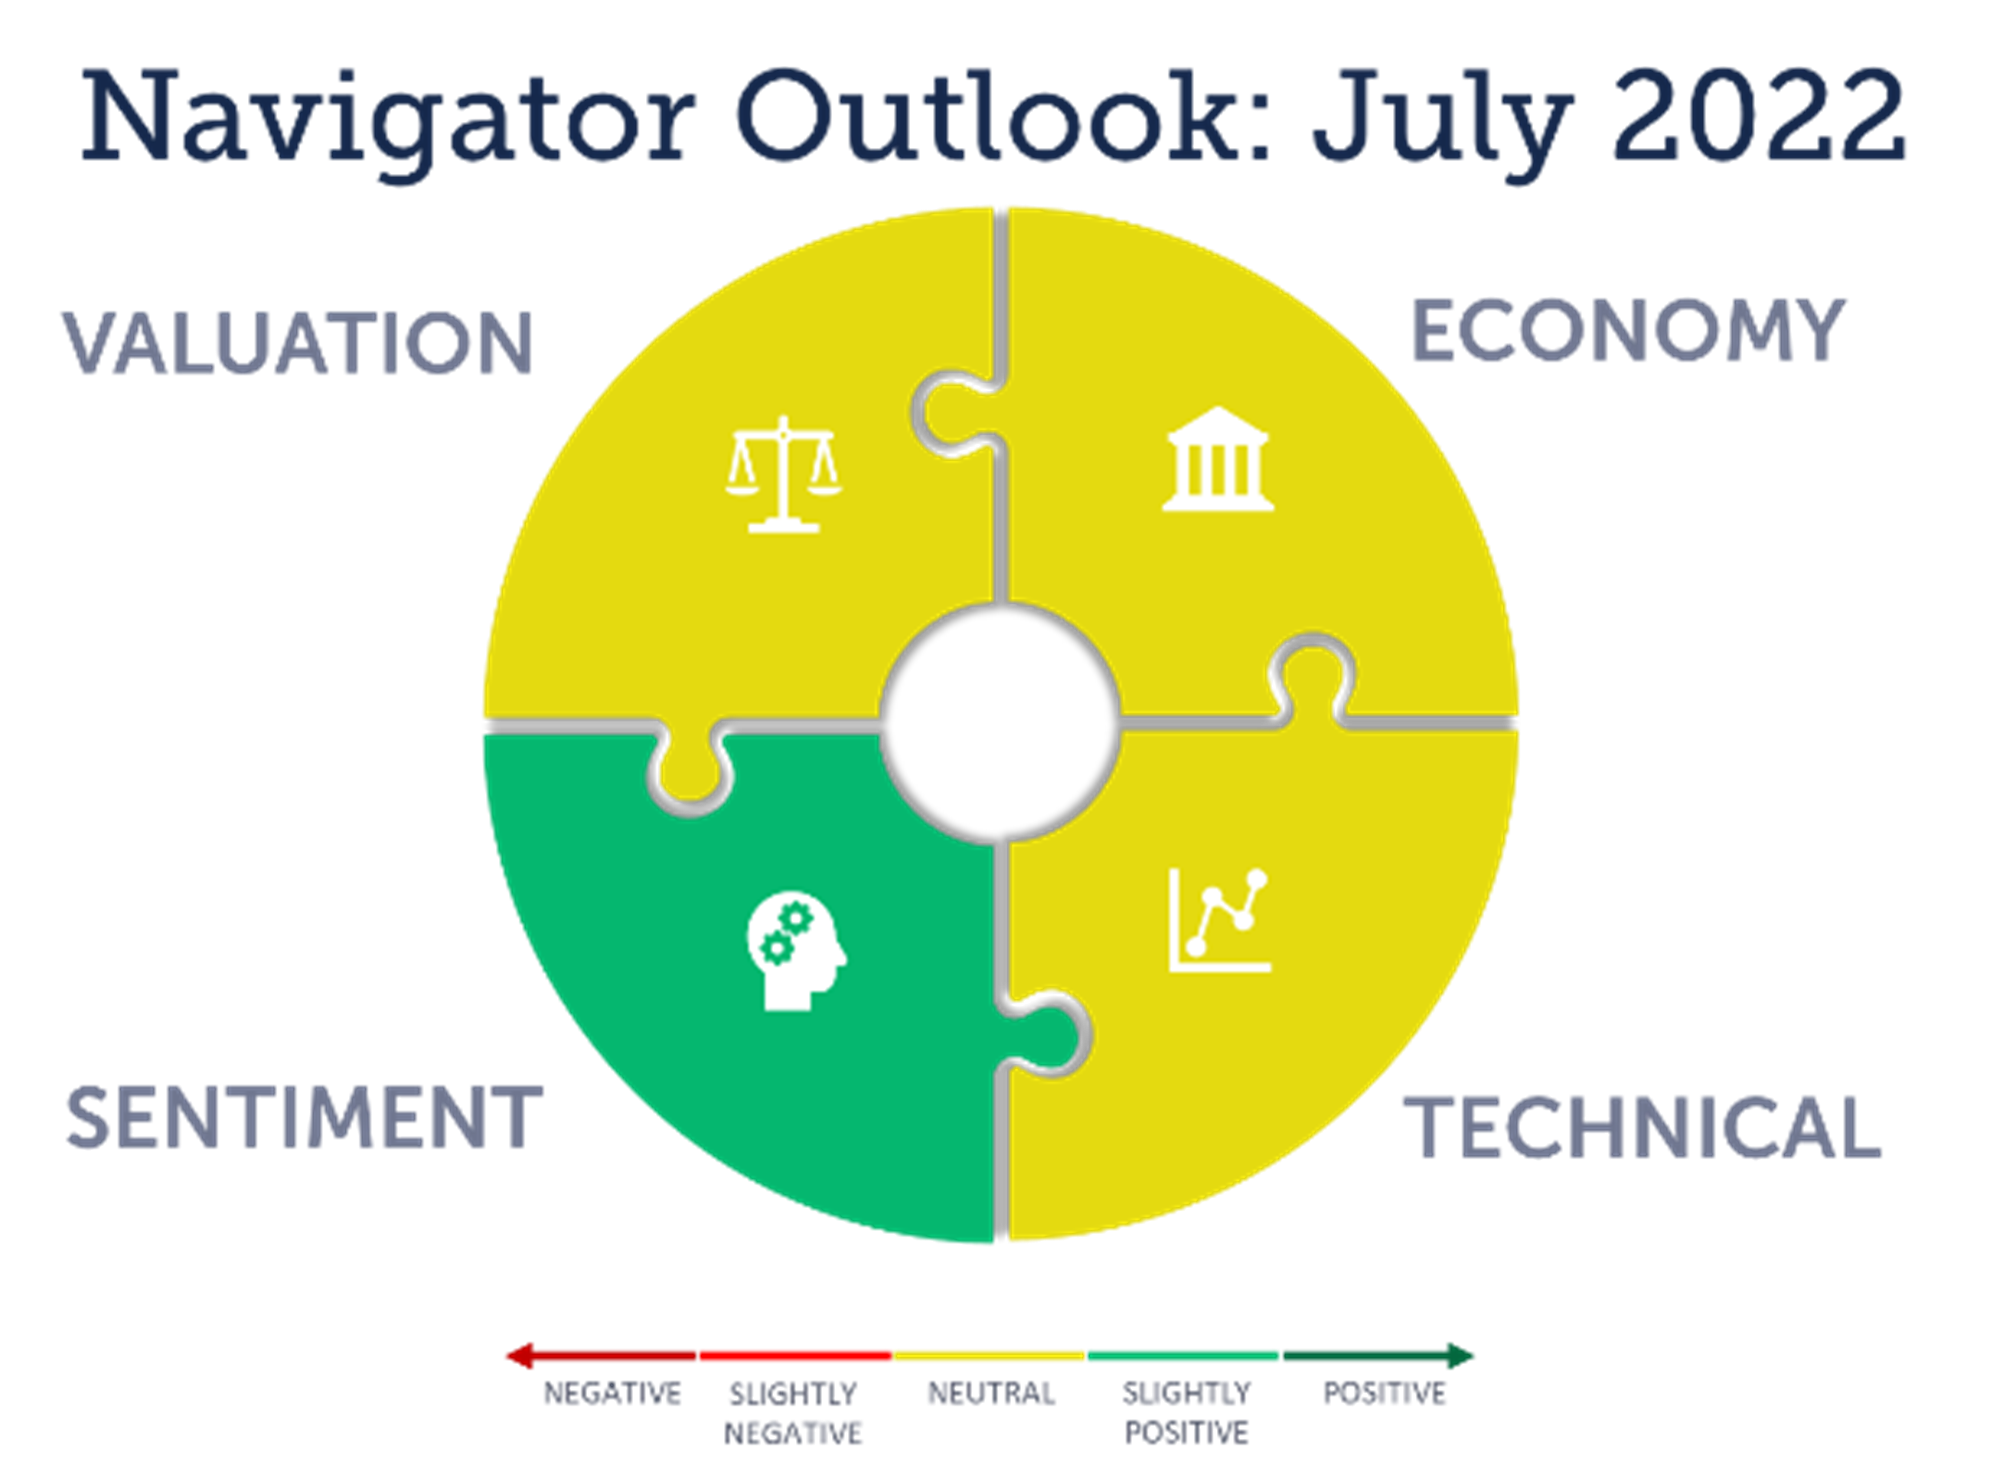
- Investor sentiment: Bearish investors either have given up on the market in the next 6 months, or they are close to throwing in the towel. We are at a very negative period of investor sentiment, as negative as we have experienced since the bottom of the 2008 Global Financial Crisis. In recent weeks there have been less than half as many bullish investors as there are bearish – in fact the last time the ratio of bulls divided by bears was this low was right near the bottom of the Global Financial Crisis, in early 2009. When the market reaches this severe level of pessimism, market rallies have historically followed shortly.
- Technical Factors: History doesn’t repeat itself, but it rhymes. Similar patterns form each time the market bottoms out; it pays to follow these technical patterns. Stock market breadth, measured by the advancing stocks minus declining stocks, seems to be stabilizing and this is an optimistic sign for recovery. Additionally, the number of stocks establishing new lows has declined, and the market itself has crossed back above the moving average of its price over the last 50 days.[2]
- Valuation: For the first time since December 2020, we are not negative on stock market valuations. The S&P 500 Forward P/E ratio is now below average when viewed across the last 25 years. Additionally, small- and mid-cap stocks are as cheap as they were during the depths of the global financial crisis. This, of course, relies on earnings to continue to grow, which is not a guarantee. Inflationary pressures are showing up in corporate earnings reports, as profit margins have declined for the last two quarters.
- Economy: We must consider two areas of the economy: inflation and the potential for a recession. Inflation has increased drastically over the last year, and recent headlines have shown continued acceleration. Looking beneath the surface of the CPI, though, indicates that pressures may be easing. The Federal Reserve carried out a decade-long policy of ultra-easy monetary policy that only compounded in the depths of the COVID crisis. However, that is changing drastically as the Fed is increasing rates and selling securities to reduce its balance sheet.
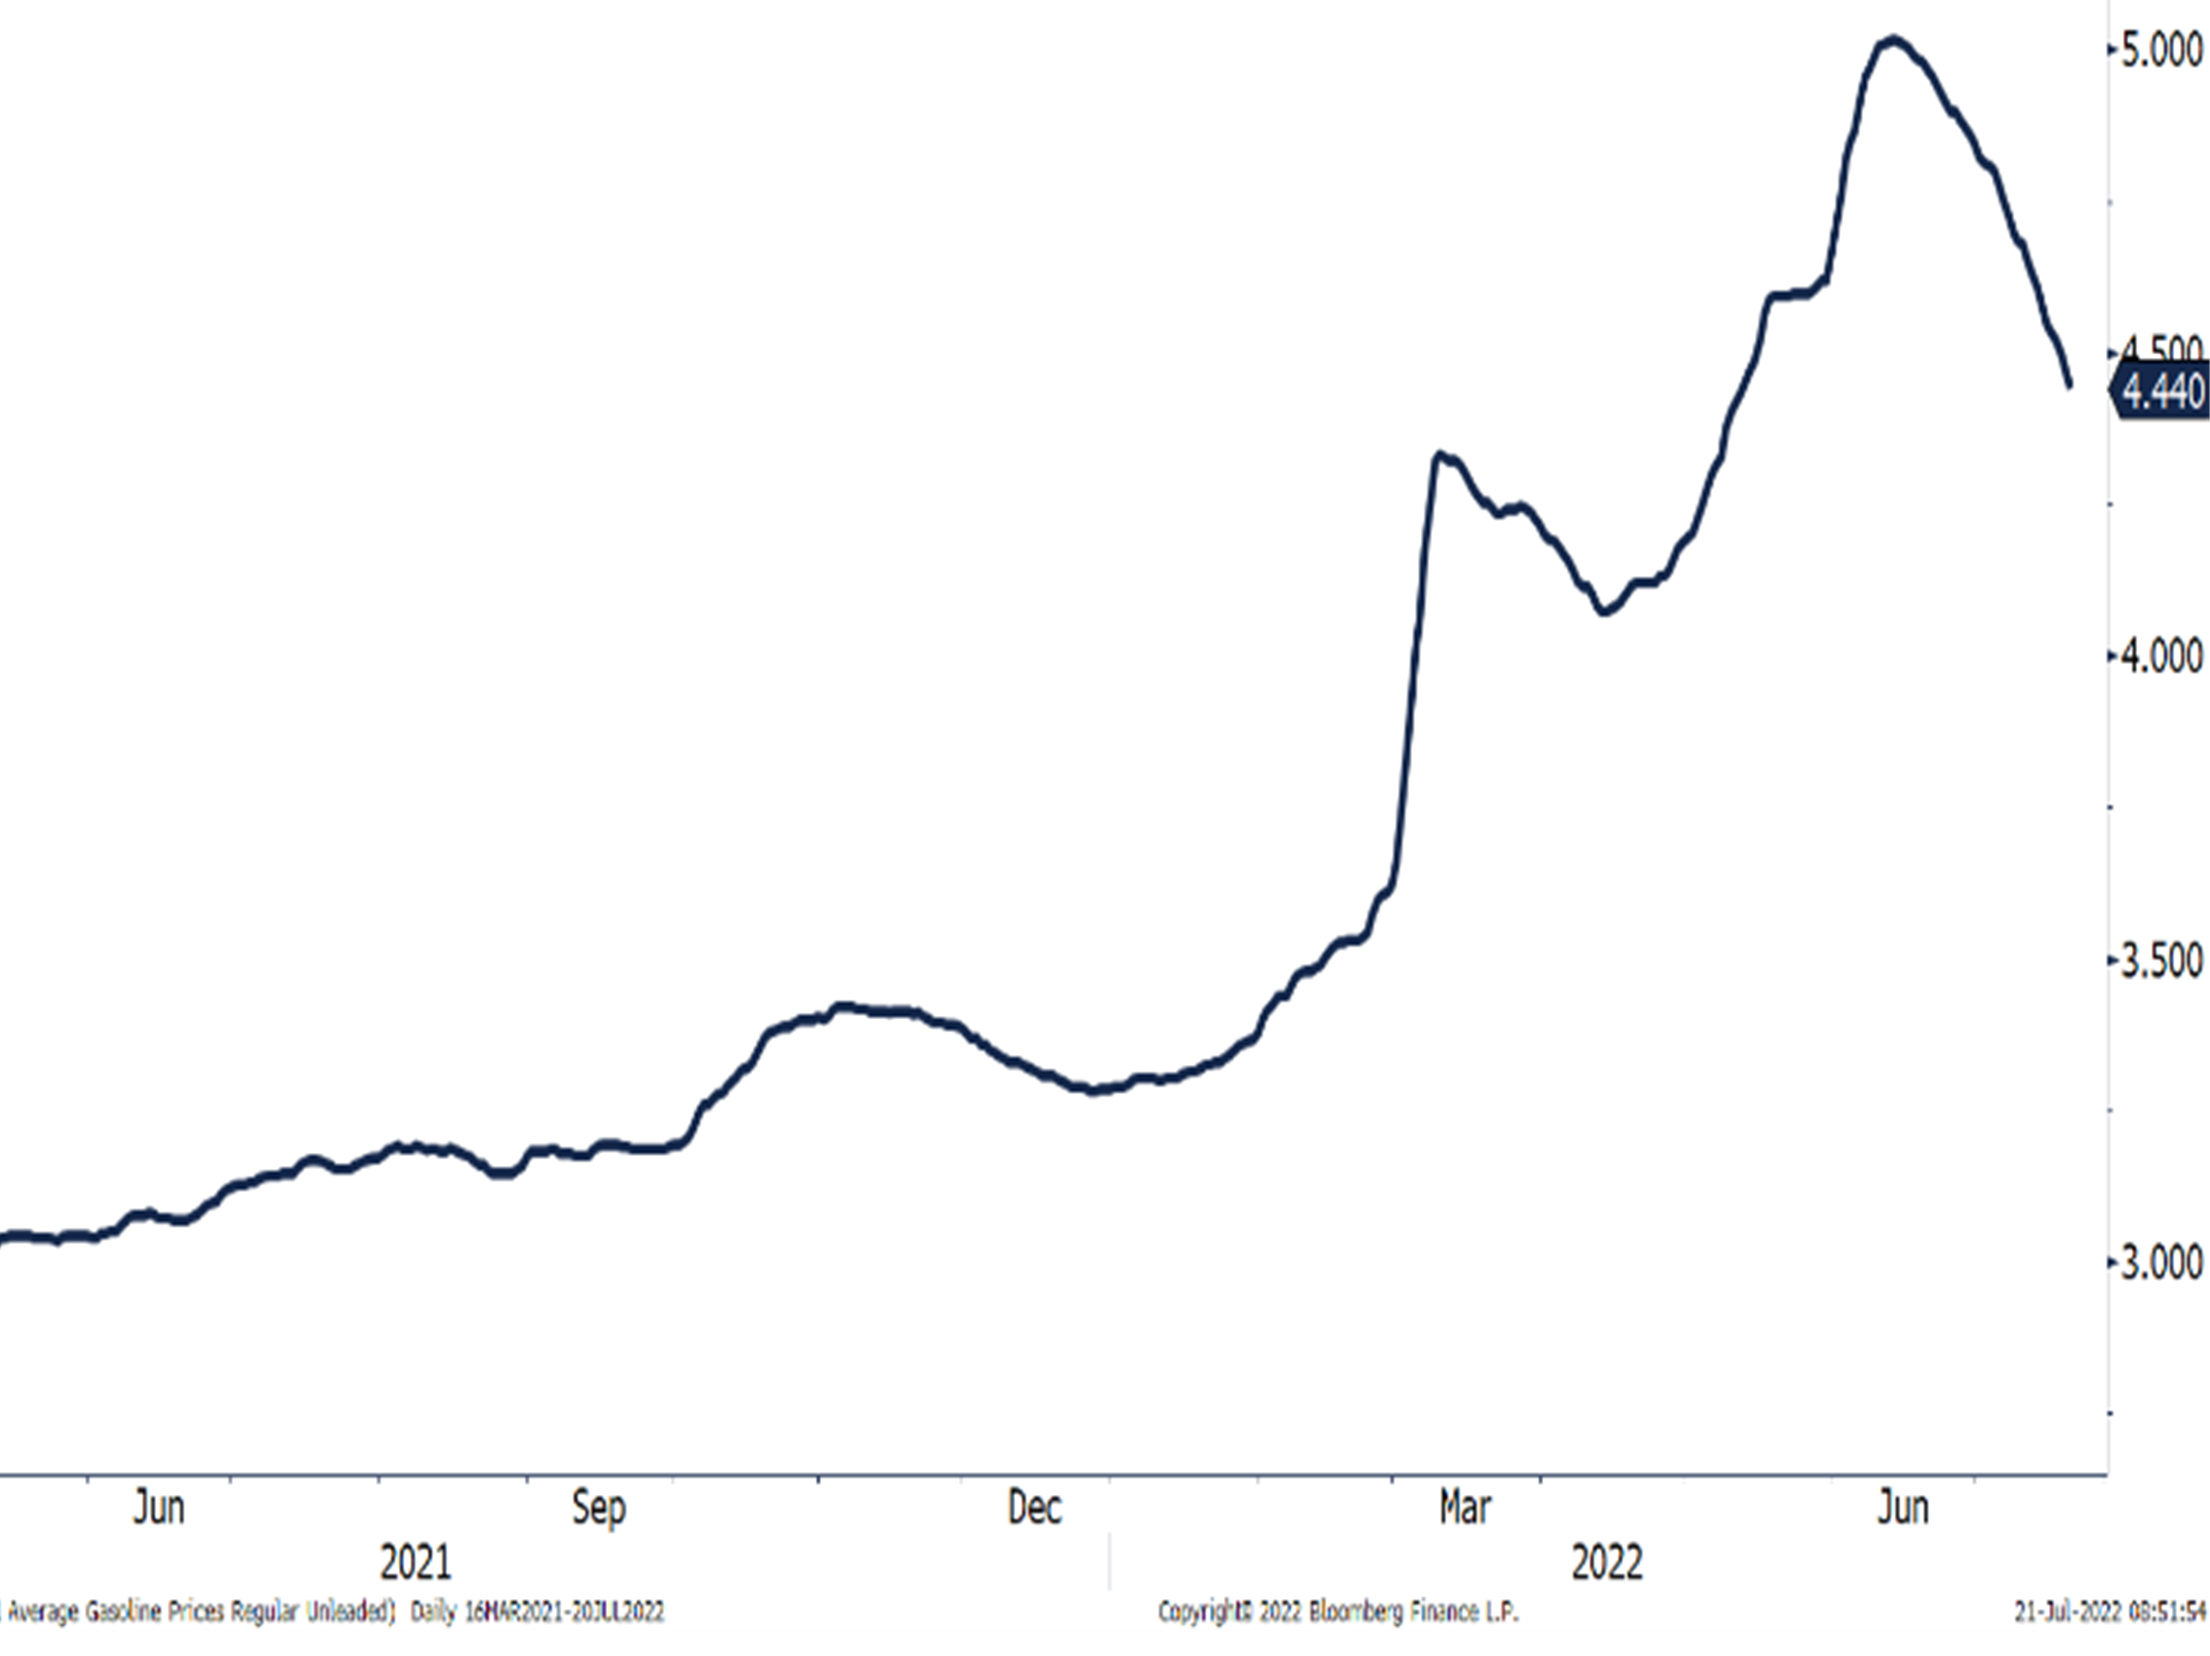 In addition to the Fed shifting monetary policy, COVID numbers are far from their peaks, and the accompanying supply chain disruptions should resolve. Finally, the war in Ukraine exponentially increased fuel prices in the first quarter. While there is no clear resolution to that conflict, energy prices have begun to moderate. After peaking slightly above $5 per gallon, the average price of a gallon of gas has come down for the last 5 weeks in a row to $4.44, as seen in the chart to the right.
Maintaining Discipline
In this environment, what is an investor to do? Here are a couple of pitfalls to avoid:
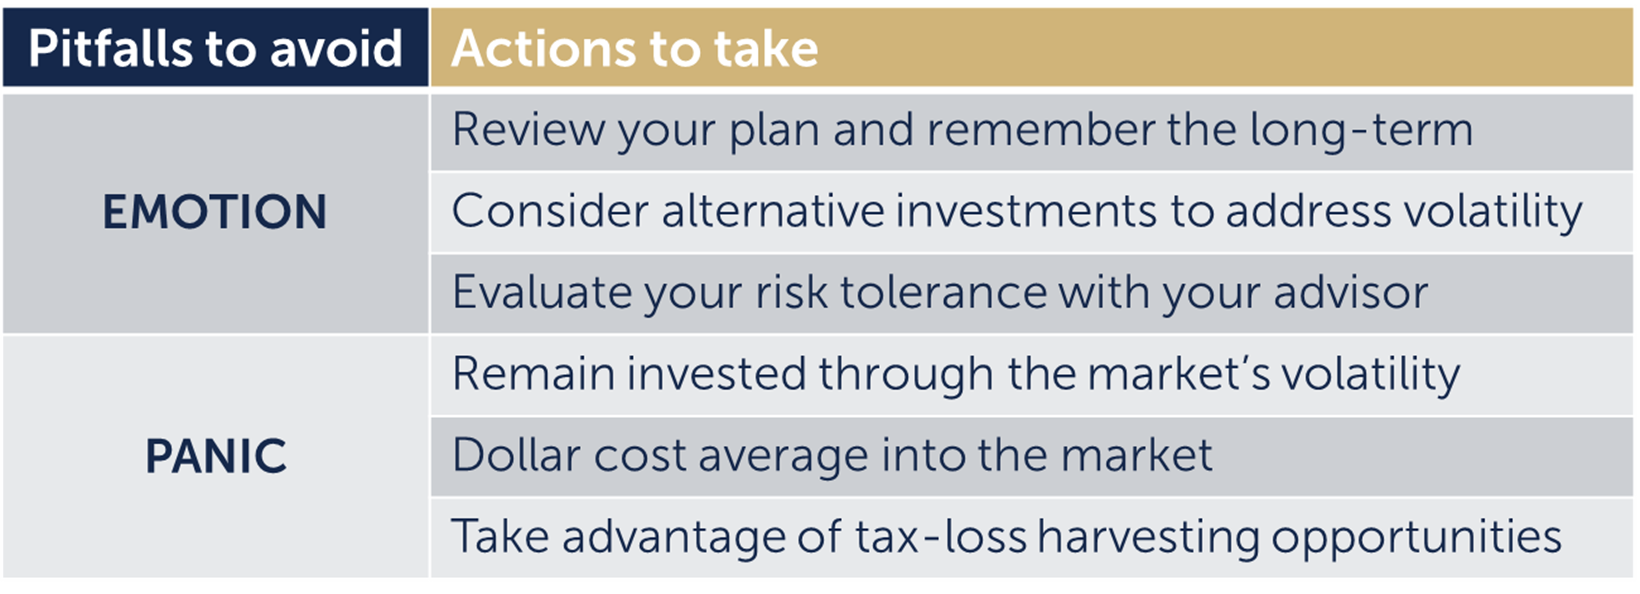
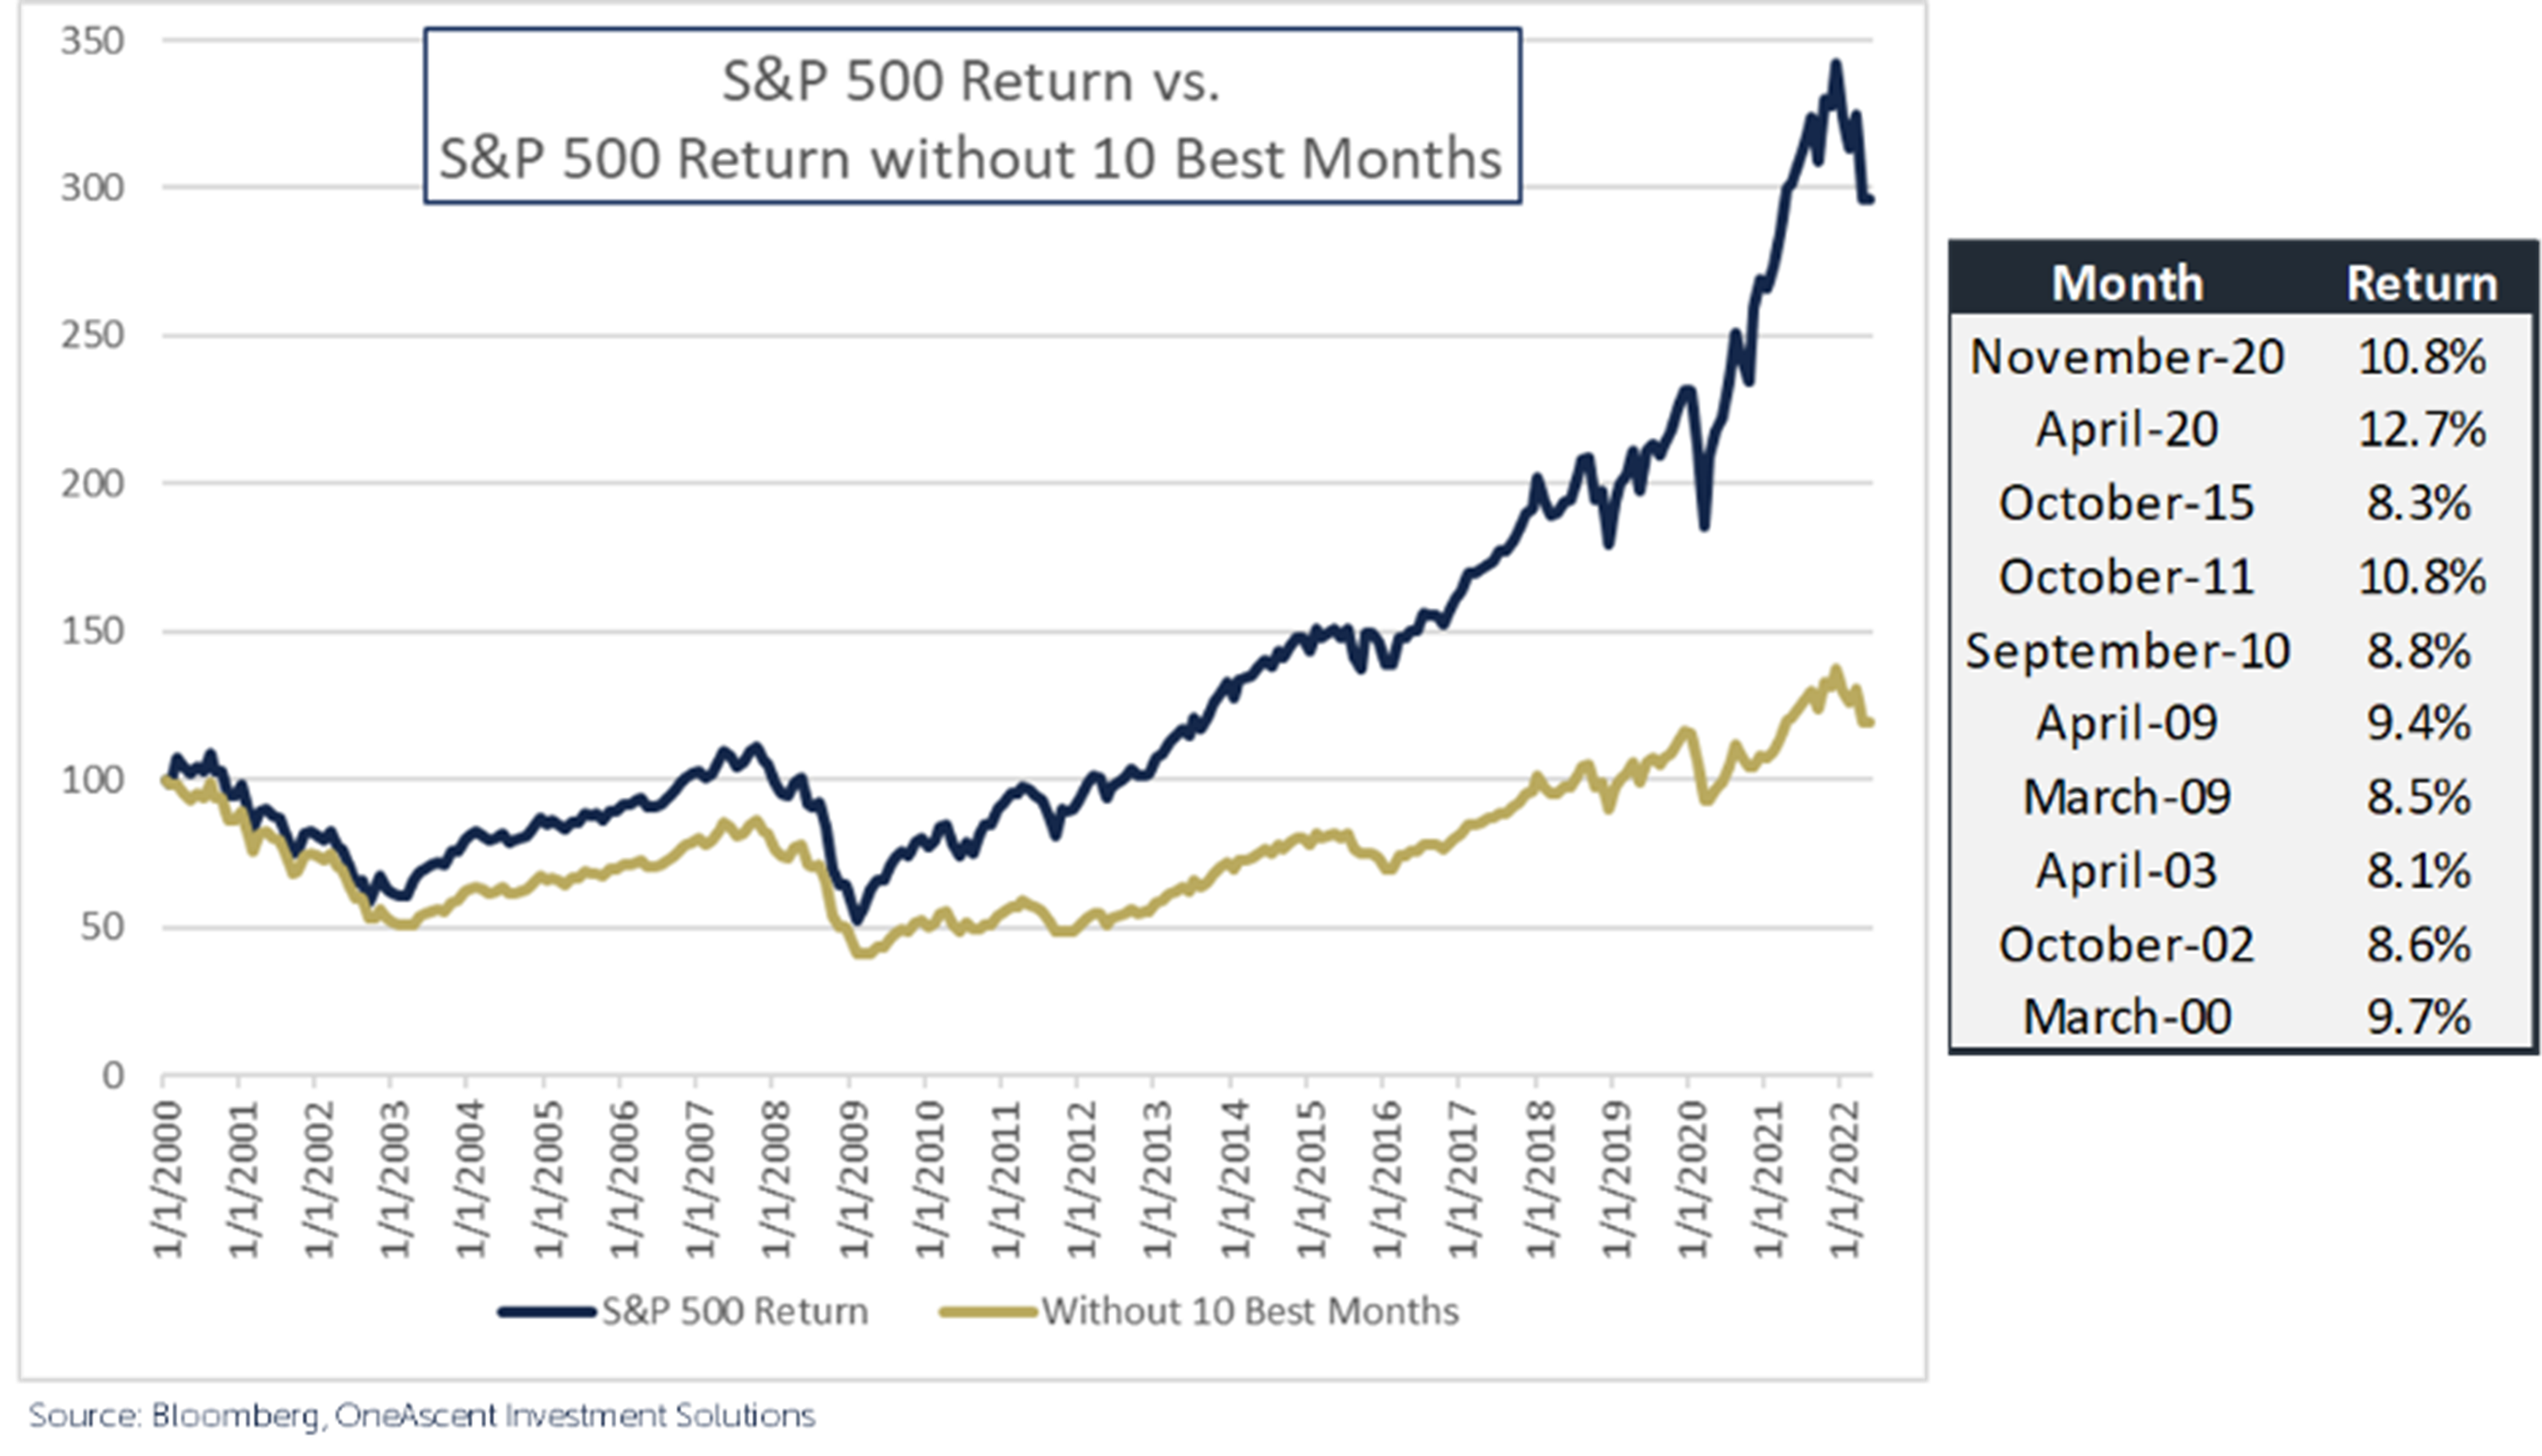 Emotional selling may cause you to miss good times in the market. The chart to the right shows that if you were not invested in the market during the ten best months since 2000, you would have gained less than half of the return available if you had stuck to your plan. Importantly, high-performing months often occur at the end of a downturn, right when investors tend to sell out of the market.
- Rather than panic, take advantage of volatility. We know that the market is volatile, and that volatility presents opportunities to dollar cost average and to realize tax losses. Maintaining discipline will allow you to take advantage of these opportunities.
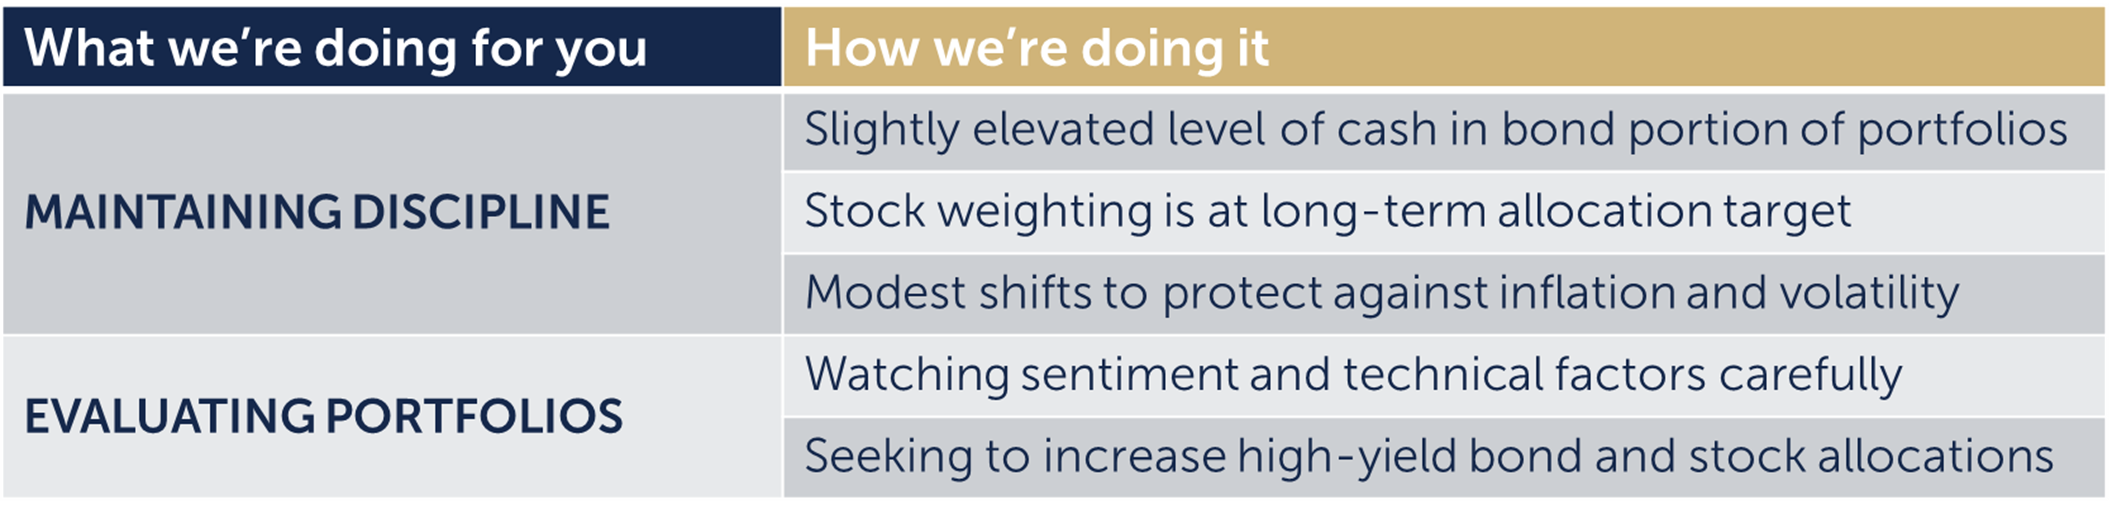
We don’t know what the market will do, but based on all of the data we’ve presented to you, here is a summary of what we are doing for you right now:
The quote at the beginning of the article points out that the stock market is much more volatile than the economy. Though we may experience a recession in the economy, we’ve already experienced one in the stock and bond markets. While we are watching closely, it’s important to remember that the market usually improves before the economy does. In our last update, we discussed that volatility in the short- to medium-term is the price investors pay to achieve positive long-term returns, and that sticking to your plan gives you the best chance to arrive at your financial destination. Discipline and patience are the keys to weathering any recession on the way to achieving your financial goals.
[1] Source: Federal Reserve Ned Davis Research
[2] Source: Bloomberg
This material is intended to be educational in nature, and not as a recommendation of any particular strategy, approach, product or concept for any particular advisor or client. These materials are not intended as any form of substitute for individualized investment advice. The discussion is general in nature, and therefore not intended to recommend or endorse any asset class, security, or technical aspect of any security for the purpose of allowing a reader to use the approach on their own. Before participating in any investment program or making any investment, clients as well as all other readers are encouraged to consult with their own professional advisers, including investment advisers and tax advisors. OneAscent can assist in determining a suitable investment approach for a given individual, which may or may not closely resemble the strategies outlined herein.