OAEM
OAEM
OneAscent Emerging Markets ETF
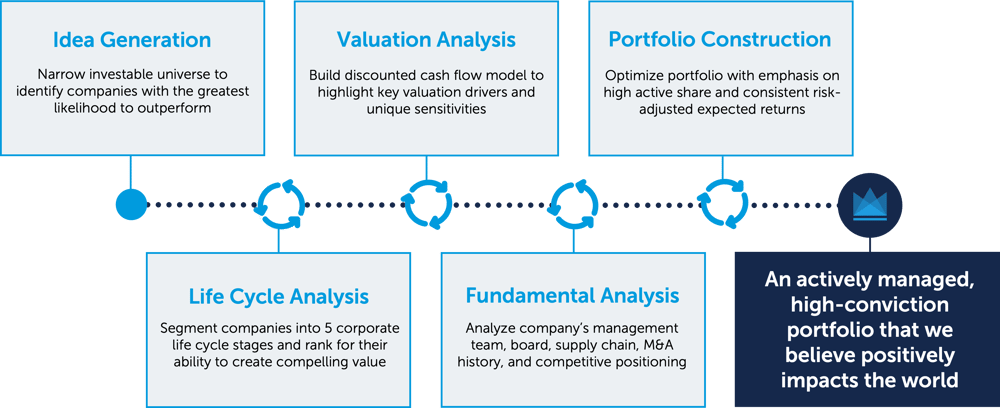
The OneAscent Emerging Markets fund takes an innovative approach to equity investing. The strategy combines the OneAscent Elevate Screening Process along with the investment team’s Life Cycle Investment approach. The team conducts extensive fundamental analysis to arrive at a concentrated portfolio of companies in emerging economies it believes are more likely to outperform.
Key Focuses:
A Focus on Societal Impact
With the help of the OneAscent Elevate Screening methodology, the investment team seeks out those companies around the world that are providing goods or services that advance the flourishing of society. A deep dive into a company’s business model, stakeholder policies, and overall community impact helps to attempt to eliminate those companies that do not share our values and thereby allowing the team to focus on companies in which our clients can be proud to own.
Unique Fundamental Framework
The investment team believes companies go through a natural corporate “Life Cycle” and understanding where a company lies along that spectrum is central to the fundamental investment process. With the help of quantitative tools, the team is able to segregate the investment universe into life cycle stages and more accurately identifying a company’s real asset growth and return on invested capital. Using this lens, the team applies a rigorous fundamental analysis process to help identify those companies more likely to create ongoing shareholder value.
Experienced Investment Team
The investment team is led by a portfolio manager with decades of investment experience. The team manages multiple, high conviction portfolio using the same rigorous bottom-up investment process.
Fund Details | As of 05/14/2025 |
---|---|
Ticker | OAEM |
Primary Exchange | NYSE Arca |
CUSIP | 90470L451 |
Inception Date | 9/15/22 |
Net Assets | $46,268,870.32 |
Shares Outstanding | 1,500,000.00 |
Gross Expense Ratio | 1.20% |
Net Expense Ratio | 1.25% |
Distribution Frequency | Annually |
Fund Price | As of 05/14/2025 |
---|---|
NAV | $30.85 |
Market Price | $30.74 |
30-day Median Bid/Ask Spread | 0.72% |
Premium Discount | $-0.11 |
Premium Discount is the amount the fund is trading above or below the reported NAV expressed as a percentage of the NAV. When the fund's market price is greater than the fund's NAV, it is said to be trading at a "Premium" and the percentage is expressed as a positive number. When the fund's market price is less than the fund's NAV, it is said to be trading at a "Discount" and the percentage is expressed as a negative number.
Historical Premium/Discount
Year 2024 | Q1 2024 | Q2 2024 | Q3 2024 | Q4 2024 | |
---|---|---|---|---|---|
Days at premium | 133 | 43 | 35 | 29 | 25 |
Days at discount | 114 | 18 | 26 | 32 | 36 |
The Premium/Discount shows the difference between the daily market price of the Fund’s shares and the Fund’s net asset value (“NAV”). Market price data reflects the official closing price. This data is provided for information purposes only and is not intended for trading purposes. Past performance does not guarantee future results.
Performance
As of 3/31/2025
Trailing Returns
3 Month | YTD | 1 Year | Since Inception | |
OneAscent Emerging Markets ETF (Price) | -1.44% | -1.44% | -3.30% | 6.68% |
OneAscent Emerging Markets ETF (NAV) | -2.70% | -2.70% | -3.89% | 6.33% |
MSCI EM NR USD Index | 2.93% | 2.93% | 8.09% | 7.94% |
Fund NAV represents the closing price of underlying securities. Closing Market Price is calculated using the price which investors buy and sell ETF shares in the market. The Closing Market Price returns in the table were calculated using the closing price and account for distributions from the funds.
The performance data quoted represents past performance. Past performance does not guarantee future results. The investment return and principal value of an investment will fluctuate so that an investor's shares, when redeemed, may be worth more or less than their original cost and current performance may be lower or higher than the performance quoted. For performance current to the most recent month end, please call 1-800-222-8274.
The Fund gross expense is 1.20%; due to fee recoupment of 0.05%, the total Fund net expense is 1.25%. The Fund’s adviser contractually has agreed to waive its management fee and/or reimburse expenses so that total annual Fund operating expenses, do not exceed 1.25% through December 31, 2025.
Source: Morningstar Direct
Elevate Stories
When a company elevates every single person and every square inch, they create stories worth sharing.
Below are examples from this fund.
TSMC
Semiconductor demands will require $3 trillion in global R&D investment over the next decade.1
Taiwan Semiconductor Manufacturing Company created a Supplier Sustainability Academy to address the issue. The revolutionary, open-source educational platform has delivered cutting-edge courses to over 200,000 supply chain workers.
Trip.com
Eighty percent of the world's population experiencing poverty lives in rural areas.2
Trip.com developed a nearly $150 million fund to drive local tourism, creating 10 industry-leading country retreats, 100 vacation villages, and 10,000 jobs in rural Asia.
Bank Rakyat Indonesia
Over half of Indonesia's population lives on less than $5.50 per day.3
Microloans empower borrowers who are unbanked or have poor credit with smaller, non-traditional loans. Bank Rakyat is the largest microlender in Indonesia, and its microlending program has become a model for the rest of the developing world.
Indofood
Two million children under 5-years-old in Indonesia suffer from severe acute malnutrition.4
The Indofood Nutrition platform researches and innovates to aid customers in making healthy food choices while also enhancing products with vital micronutrients. They also provide education and health services to mothers and toddlers through their Nutrition Care program.
Kimberly-Clark de Mexico
United States babies use approximately 50 million diapers per day, or about 18 billion per year.5
The Huggies Eco Protect baby diapers and wet wipes are designed with biodegradable materials that will reintegrate into nature in less than 3 years after use, and their packaging is recyclable and made with recycled materials.
Top 10 Holdings as of 05/14/2025 | Weight |
---|---|
BBH SWEEP VEHICLE | 15.77% |
TSMC | 10.81% |
SAMSUNG ELECTRON | 4.95% |
Hanwha Techwin Co Ltd | 4.31% |
ACCTON TECH | 4.04% |
LIG NEX1 CO LTD | 3.77% |
MEDIATEK | 3.58% |
HARMONY GOLD MNG | 3.52% |
MakeMyTrip Ltd | 3.29% |
HDFC BANK-ADR | 2.87% |
View all holdings (csv) |
As a percent of net assets. Portfolio Holdings are subject to change and should not be considered investment advice. Current and future portfolio holdings are subject to risk.
Investors should carefully consider the investment objectives, risks, and charges and expenses of the fund before investing. The prospectus contains this and other information about the fund, and it should be read carefully before investing. Investors may obtain a copy of the prospectus by calling 1-800-222-8274 or clicking the link above. The fund is distributed by Northern Lights Distributors, LLC, Member FINRA/SIPC, which is not affiliated with OneAscent Investment Solutions, LLC.
Important Risk Information:
Exchange-traded funds involve risk including the possible loss of principal. Past performance does not guarantee future results.
The Adviser invests in securities only if they meet both the Fund's investment and values-based screening requirements, and as such, the returns may be lower than if the Adviser made decisions based solely on investment considerations.
The Fund faces numerous market trading risks, including the potential lack of an active market for Fund sharers, losses from trading in secondary markets, and periods of high volatility and disruption in the creation/redemption process of the Fund. These factors may lead to the Fund's shares trading at a premium or discount to NAV.
Additional risks are included in the Fund prospectus.
1Source: Varas, Antonio, Raj Varadarajan, Jimmy Goodrich, Falan Yinug. “Strengthening the Global Semiconductor Supply Chain in an Uncertain Era.” BCG & SIA.
2Source: “UN/DESA Policy Brief #106: Reducing Poverty and Inequality in Rural Areas: Key to Inclusive Development | Department of Economic and Social Affairs.” United Nations.
3Source: “Indonesia Overview.” World Bank. (Indonesia’s population is greater than 275M people, and the World Bank poverty line is $2.15/day.)
4Source: Andriani, Helen, Erlin Friska, Miftahul Arsyi, Alphyyanto Eko Sutrisno, Alexander Waits, and Nurul Dina Rahmawati. “A Multilevel Analysis of the Triple Burden of Malnutrition in Indonesia: Trends and Determinants from Repeated Cross-Sectional Surveys.” BMC Public Health 23, no. 1 (September 21, 2023).
5Source: “Diaper Facts and Statistics: Average Cost of a Diaper.” Cross River Therapy.