It was a volatile ride for investors last week, as global equity markets declined significantly on Monday before spending the rest of the week climbing back. The S&P 500 (a proxy for US large-cap stocks) ended up rising 0.5% for the week while the MSCI ACWI index (a proxy for global stocks) gained 0.1%[1].
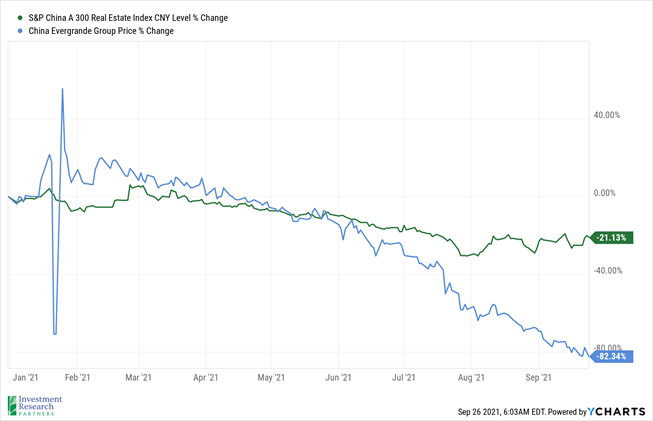
China has continued to be a source of worry in global markets. China’s Evergrande Group, one of the largest real estate developers in the country, has become so overburdened by debt that there are concerns they will collapse without government support[2]. This realization, along with concerns that defaulting on such a large debt can introduce contagion in markets, has sent the price of the stock (blue line below) plummeting since June. In fact, the entire real estate market has cooled significantly this year (see the S&P China A index in green below).

News from China also rattled the crypto currency markets last week. In the latest of a string of government crackdowns on crypto, the country banned illegal mining and offshore exchanges doing business with its citizens on Friday. Bitcoin dropped as much as 9%, and Ethereum 13%, on the news[3]. Time will tell if the inflationary pressure consumers are feeling proves transitory, as the US Federal Reserve has suggested, or more long-lasting in nature.
Prices & Interest Rates
| Representative Index |
Current |
Year-End 2020 |
| Crude Oil (US WTI) |
$73.95 |
$48.52 |
| Gold |
$1,749 |
$1,893 |
| US Dollar |
93.25 |
89.94 |
| 2 Year Treasury |
0.29% |
0.13% |
| 10 Year Treasury |
1.47% |
0.93% |
| 30 Year Treasury |
1.99% |
1.65% |
| Source: Morningstar, YCharts, and US Treasury as of September 26, 2021 |
Asset Class Returns
| Category |
Representative Index |
YTD 2021 |
Full Year 2020 |
| Global Equity |
MSCI All-Country World |
14.3% |
16.3% |
| Global Equity |
MSCI All-Country World ESG Leaders |
15.7% |
16.0% |
| US Large Cap Equity |
S&P 500 |
19.9% |
18.4% |
| US Large Cap Equity |
Dow Jones Industrial Average |
15.3% |
9.7% |
| US Small Cap Equity |
Russell 2000 |
14.6% |
20.0% |
| Foreign Developed Equity |
MSCI EAFE |
11.0% |
7.8% |
| Emerging Market Equity |
MSCI Emerging Markets |
-0.4% |
18.3% |
| US Fixed Income |
Bloomberg Barclays Municipal Bond |
1.3% |
5.2% |
| US Fixed Income |
Bloomberg Barclays US Agg Bond |
-1.2% |
7.5% |
| Global Fixed Income |
Bloomberg Barclays Global Agg. Bond |
-3.3% |
9.2% |
| Source: YCharts as of September 26, 2021 |
[1] Source: YCharts
[2] Source: What Is China Evergrande and Why Is It In Trouble? - Bloomberg
[3] Source: Bitoin ($BTC USD): China Crypto Crackdown Timeline - Bloomberg
Download PDF Version
Past performance may not be representative of future results. All investments are subject to loss. Forecasts regarding the market or economy are subject to a wide range of possible outcomes. The views presented in this market update may prove to be inaccurate for a variety of factors. These views are as of the date listed above and are subject to change based on changes in fundamental economic or market-related data. Please contact your Financial Advisor in order to complete an updated risk assessment to ensure that your investment allocation is appropriate.