Key Events: Data continued to signal a rate cut
Following the previous week’s soft employment data, the Bureau of Labor Services published their annual benchmark revisions that showed nonfarm payrolls were likely 911 thousand jobs lower than previously printed for the April 2024 through March 2025 timeframe.[1]
PPI (Producer Price Index) inflation data was below expectations, and the CPI ex Food and Energy showed an in-line result.
Market Review: String of new highs marched on
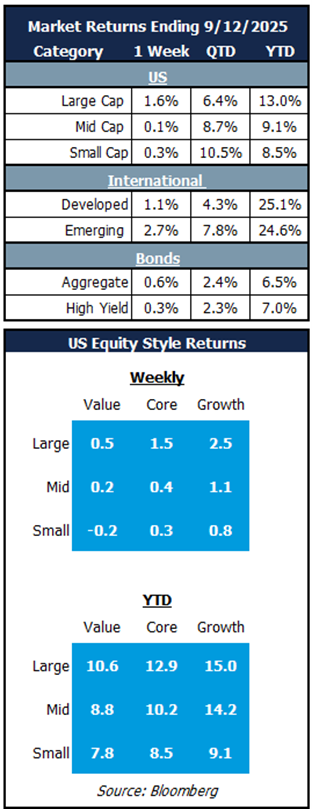
Emerging markets led the way last week as they would benefit from lower rates. Small and mid-cap stocks lagged for the week, but they still show the strongest performance quarter-to-date, while the string of new highs for large caps continued. Bonds increased on modestly lower yields.
Outlook: Lower rate outlook supports broadening
Employment concerns coupled with contained inflation data offer the Fed flexibility to cut interest rates and the market is now expecting a series of cuts throughout the next 18 months. While the S&P 500 has managed to break out into a string of new highs, small and mid-cap equities have yet to regain previous market highs.
A series of rate cuts and anticipated benefits from the benefits of OBBBA accruing to taxpayers in 2026 may provide the monetary and fiscal support needed to support a strong rotation into the rest of the market. The valuation opportunity appears to be quite robust as depicted in the chart below. The trailing price to cash flow multiple for the S&P 500 is the highest ever outside of the tech bubble at 23.5x and is nearly twice the level for the Small-cap 600 (12.2x) and Mid-cap 400 (11.9x). If the fundamental outlook for smaller cap companies improves, the valuation spread should narrow meaningfully.
This chart underscores the valuation risk inherent in large cap equities and highlights the diversification opportunity across the market cap spectrum.
Trailing Price to Cash Flow: Large-Caps leave little room for error while Small and Mid-Caps offer lower expectations and re-rating potential
OneAscent Navigator Outlook: September 2025
This material is intended to be educational in nature , and not as a recommendation of any particular strategy, approach, product or concept for any particular advisor or client. These materials are not intended as any form of substitute for individualized investment advice. The discussion is general in nature, and therefore not intended to recommend or endorse any asset class, security, or technical aspect of any security for the purpose of allowing a reader to use the approach on their own. Before participating in any investment program or making any investment, clients as well as all other readers are encouraged to consult with their own professional advisers, including investment advisers and tax advisors. OneAscent can assist in determining a suitable investment approach for a given individual, which may or may not closely resemble the strategies outlined herein.[2]
[1] Bloomberg Story: “US Insight: Job Revisions Flag We’re in Recession, or New Cycle” by Anna Wong.
[2] Market Returns reference the following indices: Large Cap – S&P 500, Mid Cap Growth – Russell Midcap growth, Mid Cap Value – Russell Midcap Value, Small Cap – Russell 2000, Developed – MSCI EAFE, Emerging – MSCI Emerging Markets, Aggregate – Bloomberg US Aggregate, High Yield – Bloomberg High Yield
OAI01340