

June 13, 2022 •OneAscent

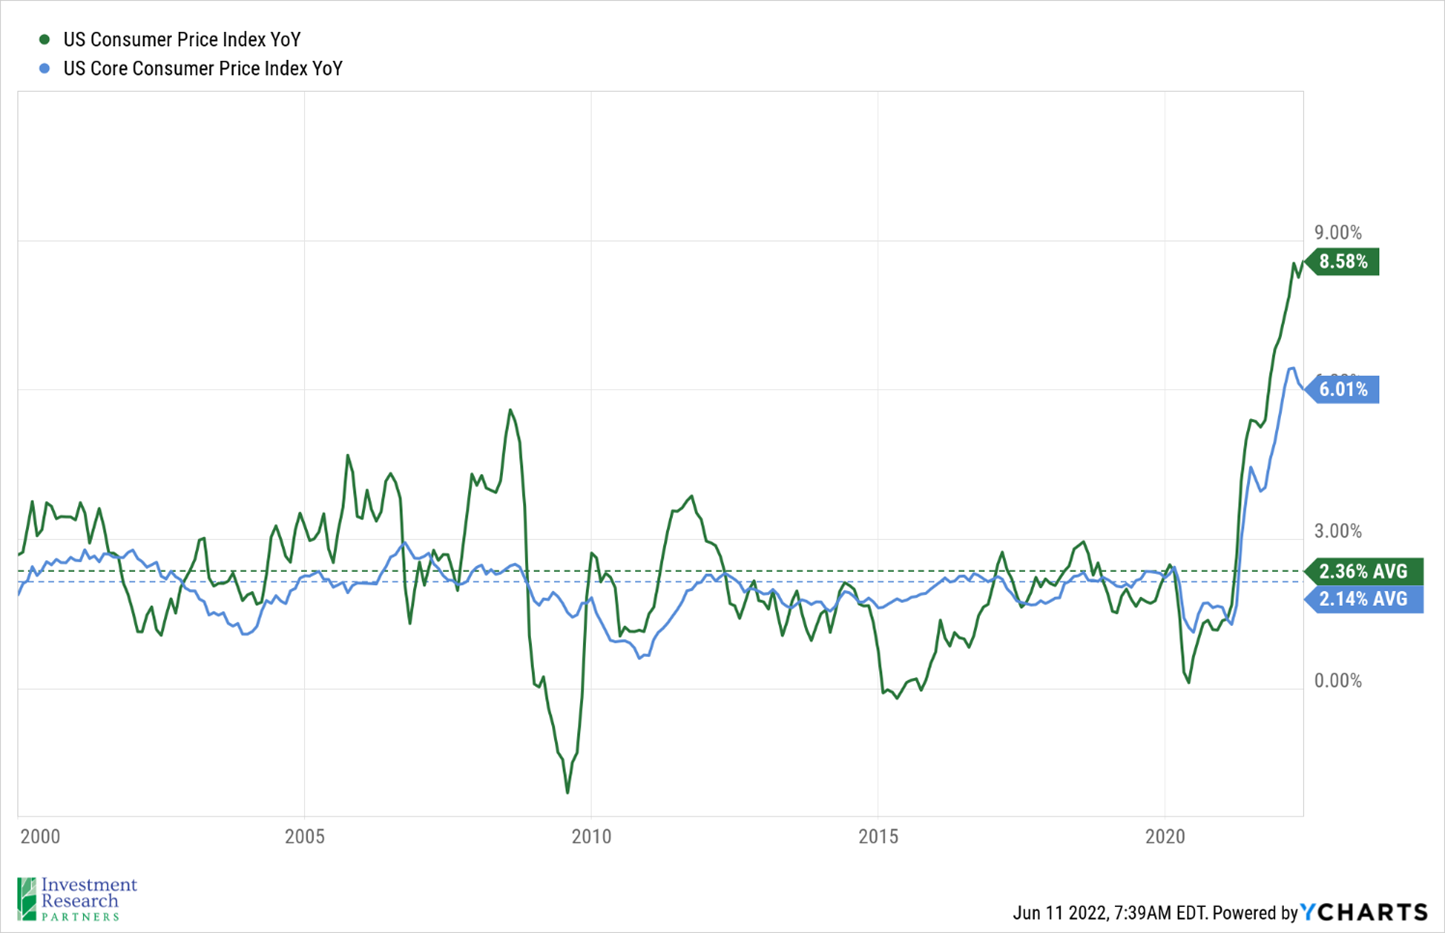
The latest year-over-year Consumer Price Index (CPI) figures, a commonly used approximation of inflation, were released on Friday and the numbers came in higher than expected (see graph below). The CPI rose 8.6 percent from prior year, marking the highest inflation reading in more than 40 years. The Core CPI, which strips out food and energy, rose 6 percent year-over-year, also exceeding estimates. Shelter, food, and gas were among the biggest contributors to the jump.[1]
Markets were rattled by the hotter than anticipated reading, fearing that the Federal Reserve (Fed) may need to be more aggressive in raising rates. The S&P 500, a proxy for large-cap US stocks, dropped 5 percent for the week and is now down more than 17 percent year-to-date. The MSCI ACWI, a proxy for large-cap global stocks, fell 4.4 percent for the week and is down 17 percent in 2022, as well. Bonds prices also dropped for the week, with the Bloomberg US Aggregate index, a proxy for investment grade bonds, losing 1.5 percent.[2]
Persistently high inflation has increased pressure on the Fed, as they attempt to balance the need to reign in inflation without tipping the economy into recession. Bond traders are now pricing in a rate hike of 175 bps between now and September. If that comes to pass, it will be the most aggressive tightening since 1994.[3]
Prices & Interest Rates
| Representative Index | Current | Year-End 2021 |
|---|---|---|
| Crude Oil (US WTI) | $120.47 | $75.37 |
| Gold | $1,870 | $1,828 |
| US Dollar | 104.19 | 95.67 |
| 2 Year Treasury | 3.06% | 0.73% |
| 10 Year Treasury | 3.15% | 1.52% |
| 30 Year Treasury | 3.20% | 1.93% |
| Source: Morningstar, YCharts, and US Treasury as of June 13, 2022 |
Asset Class Returns
| Category | Representative Index | YTD 2022 | Full Year 2021 |
|---|---|---|---|
| Global Equity | MSCI All-Country World | -17.1% | 18.5% |
| Global Equity | MSCI All-Country World ESG Leaders | -18.3% | 20.8% |
| US Large Cap Equity | S&P 500 | -17.6% | 28.7% |
| US Large Cap Equity | Dow Jones Industrial Average | -12.8% | 21.0% |
| US Small Cap Equity | Russell 2000 | -19.4% | 14.8% |
| Foreign Developed Equity | MSCI EAFE | -15.8% | 11.3% |
| Emerging Market Equity | MSCI Emerging Markets | -13.6% | -2.5% |
| US Fixed Income | Bloomberg Barclays Municipal Bond | -8.2% | 1.5% |
| US Fixed Income | Bloomberg Barclays US Agg Bond | -10.7% | -1.5% |
| Global Fixed Income | Bloomberg Barclays Global Agg. Bond | -13.6% | -4.7% |
| Source: YCharts as of June 13, 2022 | |||
[1] Source: US Inflation Hits 40-Year High of 8.6%: CPI Report - Bloomberg
[2] Source: YCharts
[3] Source: Stock Market Today: Dow, S&P Live Updates for June 13, 2022 - Bloomberg
Download PDF Version
Past performance may not be representative of future results. All investments are subject to loss. Forecasts regarding the market or economy are subject to a wide range of possible outcomes. The views presented in this market update may prove to be inaccurate for a variety of factors. These views are as of the date listed above and are subject to change based on changes in fundamental economic or market-related data. Please contact your Financial Advisor in order to complete an updated risk assessment to ensure that your investment allocation is appropriate.