

December 13, 2021 •OneAscent

Inflation was once again a headline last week as the US Consumer Price Index (CPI) released its most recent reading. The November CPI report stated that inflation increased 6.8% year-over-year, marking the highest advance in 39 years, slightly higher than October’s 6.2% print. Equity markets seemingly took the increase, which was in line with expectations, in stride, however, as both the S&P 500 (a proxy for large-cap US stocks) and the MSCI ACWI (a proxy for large-cap global stocks) advanced more than 3% for the week.[1]
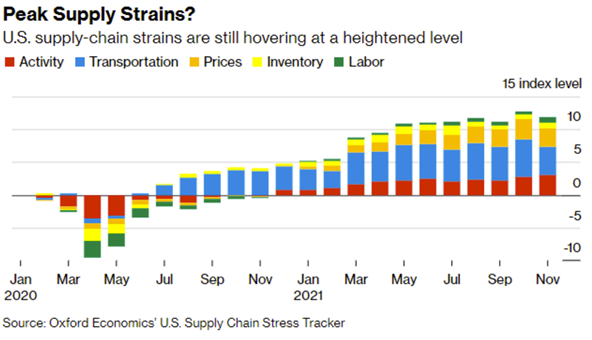
Supply chains have come into focus over the past two years as the pandemic has disrupted everyday life. The mismatch of demand for goods, which has remained high, with supply, which has been crimped by pandemic-related shutdowns, is part of the rising costs that we are all experiencing. As illustrated by the graphic below, supply chains remain at a heightened level, albeit slightly lower than last month.
On a related, but far less serious and more festive note, PNC has been tracking the prices of the gifts from the Twelve Days of Christmas song for nearly four decades. The “Total Christmas Price Index” is up 5.7% since 2019 (2020 figures were difficult to obtain because of the pandemic), with the total cost for all gifts coming in at $179,454. The cost of geese, turtle doves, and French hens were the biggest drivers in the increase this year, all up north of 40%.[2]
Prices & Interest Rates
| Representative Index | Current | Year-End 2020 |
|---|---|---|
| Crude Oil (US WTI) | $71.96 | $48.52 |
| Gold | $1,781 | $1,893 |
| US Dollar | 96.05 | 89.94 |
| 2 Year Treasury | 0.67% | 0.13% |
| 10 Year Treasury | 1.48% | 0.93% |
| 30 Year Treasury | 1.88% | 1.65% |
| Source: Morningstar, YCharts, and US Treasury as of December 11, 2021 |
Asset Class Returns
| Category | Representative Index | YTD 2021 | Full Year 2020 |
|---|---|---|---|
| Global Equity | MSCI All-Country World | 17.1% | 16.3% |
| Global Equity | MSCI All-Country World ESG Leaders | 19.3% | 16.0% |
| US Large Cap Equity | S&P 500 | 27.2% | 18.4% |
| US Large Cap Equity | Dow Jones Industrial Average | 19.7% | 9.7% |
| US Small Cap Equity | Russell 2000 | 13.0% | 20.0% |
| Foreign Developed Equity | MSCI EAFE | 9.0% | 7.8% |
| Emerging Market Equity | MSCI Emerging Markets | -2.2% | 18.3% |
| US Fixed Income | Bloomberg Barclays Municipal Bond | 1.4% | 5.2% |
| US Fixed Income | Bloomberg Barclays US Agg Bond | -1.7% | 7.5% |
| Global Fixed Income | Bloomberg Barclays Global Agg. Bond | -4.4% | 9.2% |
| Source: YCharts as of December 11, 2021 | |||
[1] YCharts
[2] The PNC Christmas Price Index | PNC
Download PDF Version
Past performance may not be representative of future results. All investments are subject to loss. Forecasts regarding the market or economy are subject to a wide range of possible outcomes. The views presented in this market update may prove to be inaccurate for a variety of factors. These views are as of the date listed above and are subject to change based on changes in fundamental economic or market-related data. Please contact your Financial Advisor in order to complete an updated risk assessment to ensure that your investment allocation is appropriate.