

April 18, 2022 •OneAscent

Last week the equity markets retreated, in general, during the holiday-shortened week. Inflation, the conflict in Ukraine, and the resurgence of Covid-19 all remain issues that are weighing on investors. The S&P 500 index, a proxy for large-cap US stocks, fell 2.4 percent, while the MSCI ACWI index, a proxy for large-cap global stocks, declined 1.7 percent.[1]
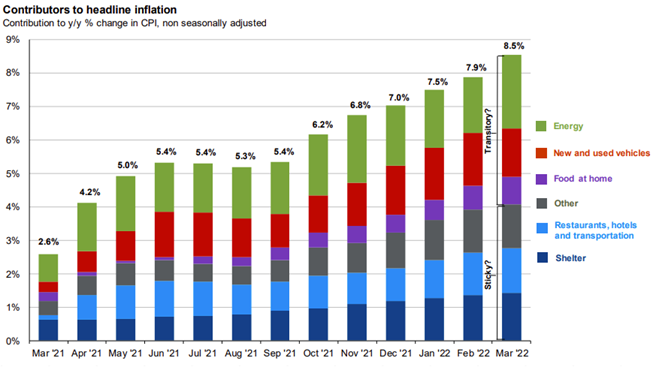
Inflation has been front and center of both investors and consumers’ minds in 2022, and the latest Consumer Price Index (CPI) reading of 8.5% year-over-year only adds to the concern (highest reading since the early 80’s). However, it is important to remember that the CPI is composed of several different categories, some of which may be more transitory in nature rather than long-lasting. Below, is a graph from J.P. Morgan summarizing the different component pieces of CPI, along with their opinion on whether the increase being experienced in each will be short-lived (transitory) or longer-lasting (sticky).[2]
Prices & Interest Rates
| Representative Index | Current | Year-End 2021 |
|---|---|---|
| Crude Oil (US WTI) | $106.54 | $75.37 |
| Gold | $1,973 | $1,828 |
| US Dollar | 100.35 | 95.67 |
| 2 Year Treasury | 2.47% | 0.73% |
| 10 Year Treasury | 2.83% | 1.52% |
| 30 Year Treasury | 2.92% | 1.93% |
| Source: Morningstar, YCharts, and US Treasury as of April 15, 2022 |
Asset Class Returns
| Category | Representative Index | YTD 2022 | Full Year 2021 |
|---|---|---|---|
| Global Equity | MSCI All-Country World | -8.1% | 18.5% |
| Global Equity | MSCI All-Country World ESG Leaders | -9.6% | 20.8% |
| US Large Cap Equity | S&P 500 | -7.5% | 28.7% |
| US Large Cap Equity | Dow Jones Industrial Average | -4.7% | 21.0% |
| US Small Cap Equity | Russell 2000 | -10.4% | 14.8% |
| Foreign Developed Equity | MSCI EAFE | -8.5% | 11.3% |
| Emerging Market Equity | MSCI Emerging Markets | -8.9% | -2.5% |
| US Fixed Income | Bloomberg Barclays Municipal Bond | -7.5% | 1.5% |
| US Fixed Income | Bloomberg Barclays US Agg Bond | -8.5% | -1.5% |
| Global Fixed Income | Bloomberg Barclays Global Agg. Bond | -9.2% | -4.7% |
| Source: YCharts as of April 15, 2022 | |||
[1] Source: YCharts
[2] Source: Source: BLS, J.P. Morgan Asset Management. Contributions mirror the BLS methodology on Table 7 of the CPI report. Values may not sum to headline CPI figures due to rounding and underlying calculations. “Shelter” includes owners’ equivalent rent and rent of primary residence. “Other” primarily reflects household furnishings, apparel and medical care services. Guide to the Markets – U.S. Data are as of April 13, 2022.
Download PDF Version
Past performance may not be representative of future results. All investments are subject to loss. Forecasts regarding the market or economy are subject to a wide range of possible outcomes. The views presented in this market update may prove to be inaccurate for a variety of factors. These views are as of the date listed above and are subject to change based on changes in fundamental economic or market-related data. Please contact your Financial Advisor in order to complete an updated risk assessment to ensure that your investment allocation is appropriate.