

March 25, 2022 •Nathan Willis

"We shall go on to the end… we shall fight in the fields and in the streets, we shall fight in the hills; we shall never surrender,"
Winston Churchill, June 4, 1940
In an indication of Ukrainian resolve this week, President Zelensky echoed Churchill’s speech, given early in Great Britain’s involvement in World War II; there is no surrender at hand. The war continues to grind forward, and while our first thought is for the people of Ukraine—mired in a worsening war and refugee crisis—markets often look past geopolitical events. We must consider portfolio positioning and adjust if necessary.
We can’t determine how, or how quickly, the war will end. Allegedly, in the immediate aftermath of the speech quoted above, Winston Churchill turned and whispered to a colleague, “And we’ll fight them with the butt ends of broken beer bottles because that’s bloody well all we’ve got!”[1] This points to the uncertainty of war. The outcome is not assured until the fighting is over and peace is negotiated.
However, a look at the geopolitical effects of the war indicates that inflation is likely to remain higher and economic growth lower, with impacts felt more acutely in Europe. Despite a murky future, there are clues we analyze to inform sound investment decisions. Added into the wartime haze this week were hawkish comments from Federal Reserve Governor Powell; on Monday he reaffirmed a strong commitment to fighting inflation. This policy guidance and market reaction give us further clues that recession risks are higher in the US than they have been for some time. Valuations for most asset classes have reset to a lower level, and relative valuations among asset classes need to be factored into investment decisions. OneAscent portfolios are positioned appropriately given the risks, opportunities, and potential outcomes.
Update on the war and market reaction
Russian forces have seemingly stalled on several fronts, as Ukraine has put up stiffer resistance than expected. The Russian performance has been significantly worse than the world (and Mr. Putin) expected , which has increased risks. Specifically, the world is reacting to the potential that Mr. Putin might take extreme measures, including the potential use of chemical or nuclear weapons. This has galvanized the European and NATO alliances. Notably, last week , heads of state of three NATO countries (Poland, Czech Republic, and Slovenia) visited Kyiv to express support for Ukraine. Given these developments, the prospects for a quick resolution to the war seem to have lessened, worsening the outlook for the Ukrainian people and the markets.
The humanitarian crisis is now, without a doubt, the worst since WWII. The United Nations estimates that over 10 million Ukrainians have been displaced, with more than 3 million having already fled Ukraine.
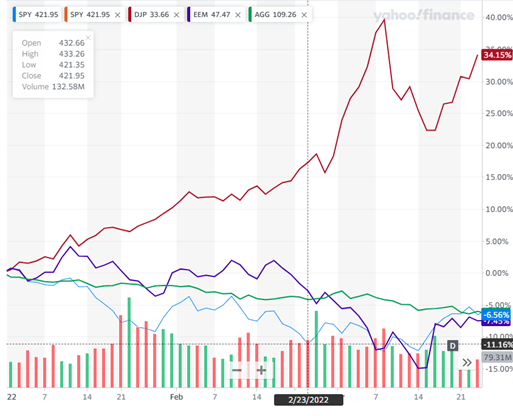
The stock, bond, and commodities markets have reacted to the war. The chart on the left shows the performance of various asset classes for the year through March 23, with a vertical line the day before Russia invaded Ukraine. The broad commodities markets, represented by the red line, significantly accelerated their already strong rise. This was driven primarily by oil, reflecting worries about Europe’s energy supplies, but a broad array of commodities participated in the gains. Emerging market stocks (purple line) fell quickly before recovering some ground, while US stocks (blue line) recovered ground that was lost before the war, likely due to the perception of the US as a safe haven. Interestingly, US bond markets (green line) have remained in the negative as the war has unfolded; the Bloomberg US Aggregate Bond Index is down over 6% for the year through March 23. Often in times of crisis the US bond market performs well due to its perceived safety. Since that hasn’t been the experience during this crisis, we ought to reconsider opportunities and risks in the market and how to position portfolios.
Stagflation?
Leading up to the war in Ukraine, US bond and stock markets reacted negatively to the increase in inflation, adjusting expectations to the reality of the low interest rate environment coming to an end. The increase in interest rates caused bond and stock valuations to decline; higher PE sectors, such as technology, felt this most acutely, as they rely on strong growth in the future to justify their current value.
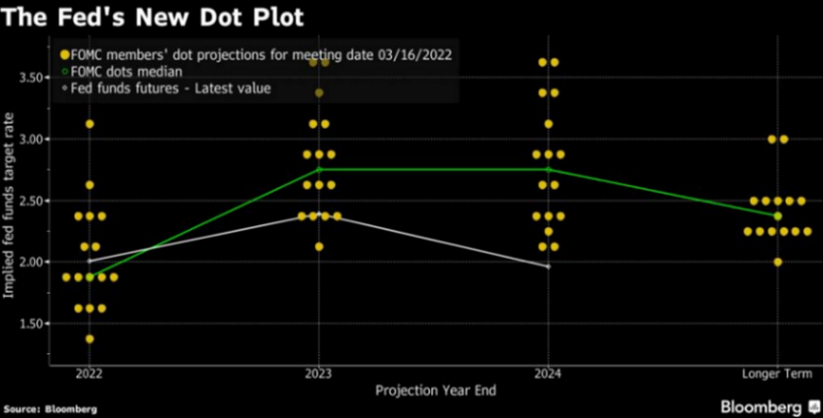
This represents a sea change. In recent history, bonds have been considered a reliable diversifier to stocks, increasing in value when stocks were selling off - but this may not be the case in the future. The dots in the chart to the right (and the average, represented by the green line) illustrate the expectations of Federal Reserve Governors for the Fed Funds target rate. They expect to raise the rate in the next couple of years to a “normalized” rate, which they believe to be somewhere between 2.0% and 3.5%, significantly higher than the 0.25% currently in place. The white line represents expectations of market participants, which are lower than the expectations of the policy-setting Federal Reserve Governors. While stocks and bonds have gotten cheaper this year, this disconnect between the market’s expectations and policymaker’s expectations suggests that both may be at risk for further downside. Why is there such a disconnect?
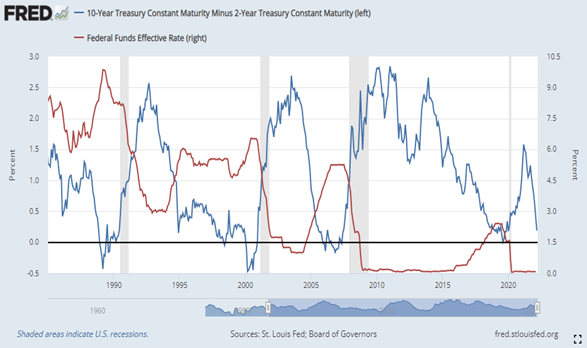 One explanation is the effect rate increases have on the economy. A common perception is that Fed rate increases drive the economy into recession. This can be illustrated by looking at the yield curve, which shows the difference between longer-term rates and shorter-term rates, alongside the absolute level of interest rates. When long-term rates are lower than short-term rates, that means the market is worried about economic growth in the future. This often happens as the Fed begins a rate hiking cycle. The chart above illustrates this: as the Fed increases rates (the red line) the yield curve flattens, then tends to invert (the blue line), followed by recessions (gray shaded areas). While the yield curve is not inverted today, the recent move toward zero illustrates that market participants are worried about future economic growth.
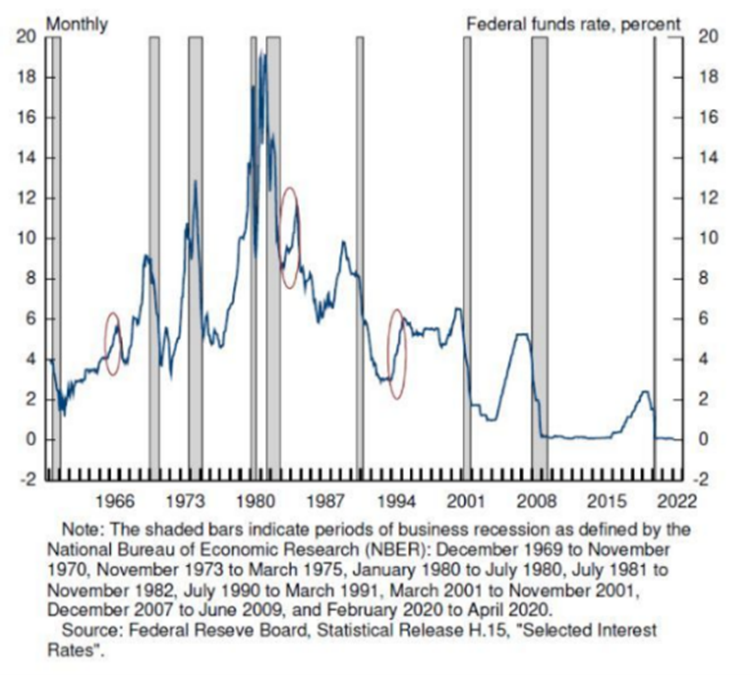
Fed Governor Powell appears less worried about growth than inflation. In a speech on March 21, he showed the chart to the left. In contrast to the yield curve, he focused on the absolute level of the Fed Funds rate: the rate the Federal Reserve uses to implement policy (it is the only interest rate they directly control). Governor Powell used this chart to illustrate that the Federal Reserve has, in fact, embarked on three rate hiking cycles that did not lead to recessions – at least not immediately. This is his justification for focusing on inflation even as the market worries about growth.
The war has only worsened inflationary pressures, and they are likely to remain longer than we expected just a few months ago. Paired with growth concerns due to the war, the risk of a Fed policy error may have increased. With the Fed focused on inflation and the market worried about recession, we must also consider the risk of stagflation. Stagflation is an economic situation that is as bad as the word sounds: inflationary forces hurting our wallets right when growth is low or even negative. We expect inflationary periods to occur when the economy is growing, but stagflation represents a difficult economic situation with different risks and opportunities for portfolios.
Portfolio Risks and Opportunities
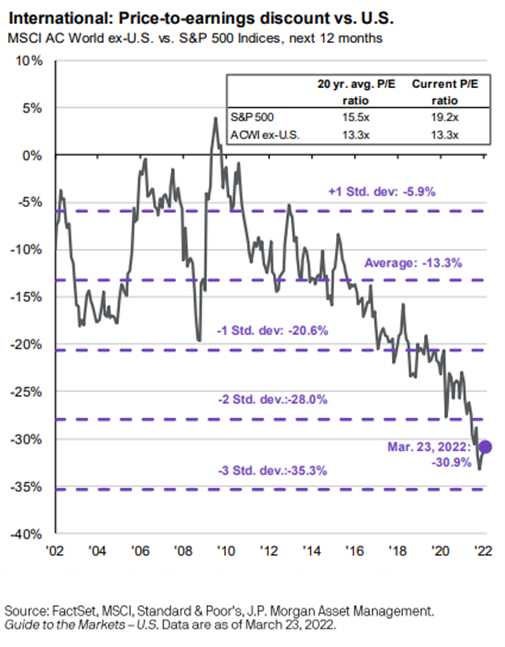 OneAscent portfolios are positioned appropriately given these uncertainties. In the equity portfolio, we hold a substantially diversified selection of stocks, with significant allocations to international holdings. While these holdings have been hurt by the war, value remains. At the beginning of the year, international stocks were trading at a significant discount to US markets - a discount which remains today. This is shown in the chart on the right . One area that has adversely affected portfolios is our position in midcap growth stocks. In our Q1 2022 update, held in mid-January, we discussed the need to remain focused on the long term of these stocks, whose valuations rely much more on future growth, especially during periods of volatility. We are in such a period now, and valuations of our mid-cap stocks have gotten more attractive relative to their own growth and relative to large cap stocks. In our bond portfolios , we have made a tactical decision to shorten the duration of the holdings, reducing our exposure to higher rates. This move has helped performance as rates have increased. We remain committed to a fully diversified portfolio and will continue to position for the opportunities available in the marketplace.
[1] Source: Fight Them on the Beaches - International Churchill Society (winstonchurchill.org)
Past performance may not be indicative of future results. Therefore, no current or prospective client should assume that the future performance of any specific investment, investment strategy (including the investments and/or investment strategies recommended by the adviser), will be profitable or equal to past performance levels.
This material is intended to be educational in nature, and not as a recommendation of any particular strategy, approach, product or concept for any particular advisor or client. These materials are not intended as any form of substitute for individualized investment advice. The discussion is general in nature, and therefore not intended to recommend or endorse any asset class, security, or technical aspect of any security for the purpose of allowing a reader to use the approach on their own. Before participating in any investment program or making any investment, clients as well as all other readers are encouraged to consult with their own professional advisers, including investment advisers and tax advisors. OneAscent can assist in determining a suitable investment approach for a given individual, which may or may not closely resemble the strategies outlined herein.
Any charts, graphs, or visual aids presented herein are intended to demonstrate concepts more fully discussed in the text of this brochure, and which cannot be fully explained without the assistance of a professional from OneAscent. Readers should not in any way interpret these visual aids as a device with which to ascertain investment decisions or an investment approach. Only your professional adviser should interpret this information.