

September 2, 2025 •Peter Klingelhofer

August Review – Powell Pivot in Jackson Hole Signals Potential Path to Lower Rates
At this year’s Jackson Hole Symposium, Fed Chair Jerome Powell carefully assessed the risks confronting policymakers as they strive to balance their dual mandate of maintaining price stability while achieving maximum employment. He concluded that inflation pressures remain elevated, but warned that labor market concerns have shifted the “balance of risks” 1 sufficiently to warrant a change in policy.
The chart at right shows the Fed Funds Rate minus the Fed’s preferred gauge of inflation, Core PCE. Currently, Fed Funds is running 162 basis points above inflation and Chair Powell acknowledged that policy is in restrictive territory. He also downplayed inflation risks posed by tariffs, signaling the likelihood of resuming rate cuts in September. The market surged to new all-time highs on the news, anticipating a series of cuts, with five cuts priced in by the end of 2026.2
A sustained cycle of interest rate reductions would provide significant relief to borrowers who have financed their future at higher rates, including consumers with higher-rate mortgages and the US Government. Notably, President Trump has urged the Fed to lower rates, citing the Government’s rising interest burden, which now surpasses defense spending (as illustrated in the accompanying chart). Furthermore, lower rates combined with the tax benefits from the passage of OBBBA would be expected to stimulate economic growth in 2026.

Short-term benefits are clear, but the market may be overlooking some key long-term risks. Before we delve further into the implications for the market outlook, let’s review last month:
August Market Review
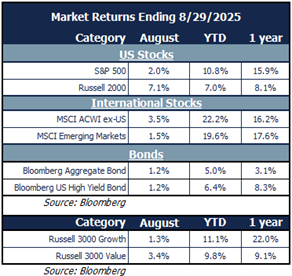
Stocks advanced for the fourth straight month as solid second quarter earnings reports continued, and the Fed indicated a path to lower rates is likely to resume in September:
- Small caps stocks surged, handily beating large caps (though they still lag for the year).
- Value stocks outdistanced growth stocks, following four months of growth dominance.
- International equities topped the US with the difference stemming from currency. Emerging markets lagged developed markets but remain quite strong for the year.
- Investment-grade and high-yield bonds rose as interest rates declined in August on the back of weak payrolls data at the start of the month and dovish commentary from the Fed. High-yield spreads continue to be very tight versus history.
Sector performance reflected the broadening theme by rotating away from some year-to-date leaders into some recent laggards:

- All sectors except utilities rose in August and all sectors are now positive year-to-date.
- Materials led with a 5.8% gain, followed by healthcare (+5.4%) and energy (+3.6%).
- Three of the best performing sectors on a year-to-date basis lagged: utilities, industrials and technology.
- Financials and communication services were in the middle of the pack, but they have been stalwart leaders throughout the year. Financials have benefited of late from the anticipation of a steepening yield curve and strong M&A activity.
Our Navigator framework informs our outlook.
September 2025 Navigator Outlook
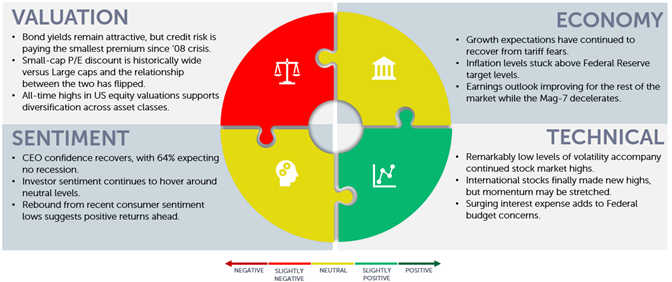
Economy: Growth expectations have continued to recover from tariff fears. Inflation levels stuck above Federal Reserve target levels. Earnings outlook improving for the rest of the market while Mag-7 decelerates.
Technicals: Remarkably low levels of volatility accompany stock market highs. International stocks finally made new highs, but momentum may be stretched. Surging interest expense adds to Federal budget concerns.
Sentiment: CEO confidence recovers, with 64% expecting no recession. Investor sentiment continues to hover around neutral levels. Rebound from recent consumer sentiment lows suggests positive returns ahead.
Valuation: Bond yields remain attractive, but credit risk is paying the smallest premium since ’08 crisis. Small-cap P/E discount is historically wide versus Large caps and the relationship between the two has flipped. All-time highs in US equity valuations supports diversification across asset classes.
Outlook and Recommendations: Concentration risk offset by strategic diversification
The strong market rally since the early April lows has been supported by three important factors: 1) the passage of OBBBA, 2) strong earnings in the second quarter despite tariff concerns, and 3) the anticipation of monetary policy easing starting in September. Powell’s Jackson Hole speech solidified the near-certain prospect of rate cut in September. The implied certainty of more rate cuts to follow has pulled future market value forward by raising valuations to all-time highs based on the aggregate valuation measure depicted below. 3

The technology sector has been the primary driver of the current valuation extreme. The sector trades at a forward P/E ratio of 30x and is in the 97th percentile of its 10-year valuation range.4 Eight of the Top 10 market caps in the S&P 500 emanate from the technology sector and the Top 10 stocks comprise 40% of the value of the S&P 500 index despite representing just 2% of its constituents. This concentration level is unprecedented in the modern era, surpassing the 1999 tech bubble’s peak at 26%. 5
This divergence is striking, especially considering the earnings outlook for the rest of 2025 and throughout 2026. The Mag-7 tech stocks (Apple, Amazon, Google, Nvidia, Meta, Microsoft and Tesla) are projected to deliver a meaningful slowdown in earnings growth while the broader S&P 500 is expected to experience a modest earnings uptick as depicted in the chart below.

The market may be starting to take notice as the fever pitch for technology exposure reached a peak in the first half of August followed by a healthy rotation into other sectors and smaller cap companies during the second half of the month. While conditions suggest a potential reversion from this extreme concentration, the ongoing AI infrastructure build-out may temper the shift. A prolonged, uneven normalization is more likely than a sharp reset.
Portfolio Construction and Positioning
The supportive fiscal and monetary environment, including OBBBA’s tax benefits in early 2026 and anticipated rate cuts, has fueled the S&P 500’s record concentration but introduces risks. With five rate cuts projected by the end of 2026, inflation must trend toward the Fed’s 2% target. However, OBBBA’s stimulus and potential tariffs could sustain inflationary pressures, complicating the Fed’s path. The new Fed Chair in May 2026 may face a dilemma: pause rate cuts or continue despite persistent inflation.
Given current valuations, equity returns may moderate compared to recent years. Investors should consider diversifying beyond tech-heavy indices, focusing on international diversification, undervalued sectors and smaller-cap stocks to mitigate concentration risk and capture potential upside from broader market participation. Our strategic portfolio allocation incorporates these factors.
Our Navigator process helps guides both short- and medium-term tactical adjustments:
- We added small-cap exposure in the Navigator as recent trends have turned more favorable.
- We’ve maintained our emerging markets exposure but have eliminated our international exposure due to stagnating short-term earnings trends and short-term momentum risk.
- We increased large-cap exposure in the Navigator (but maintain a core strategic underweight due to high valuations); large-cap shows a high short-term ranking due to current momentum and relative earnings strength. Short-term and long-term views can often be contradictory because valuation has little to no factor impact on the short run view, but it is a heavy factor in the long-term.
- We maintain exposure to mortgage-backed securities that offer an attractive risk-reward profile.
Looking further ahead, we’re also focused on several long-term positioning themes:
- Alternative investments may enhance portfolio resilience by offering both downside protection through hedging strategies and upside potential through private market opportunities.
- Fixed income has become more compelling, with the broad bond market now yielding nearly 2% above inflation, its most attractive real yield since 2011.
- Mid-cap equities remain a key overweight in our portfolios, as their relative valuations offer strong potential for long-term, risk-adjusted returns.
Our goal is to build portfolios that are resilient and capable of compounding effectively over time. While risks remain, the strong rally since the April lows is a testament to sticking with a low turnover strategy that adheres to discipline and diversification.
This material is intended to be educational in nature, and not as a recommendation of any particular strategy, approach, product or concept for any particular advisor or client. These materials are not intended as any form of substitute for individualized investment advice. The discussion is general in nature, and therefore not intended to recommend or endorse any asset class, security, or technical aspect of any security for the purpose of allowing a reader to use the approach on their own. Before participating in any investment program or making any investment, clients as well as all other readers are encouraged to consult with their own professional advisers, including investment advisers and tax advisors. OneAscent can assist in determining a suitable investment approach for a given individual, which may or may not closely resemble the strategies outlined herein.
[1] Source: Powell’s speech: “Labor Markets in Transition: Demographics, Productivity, and Macroeconomic Policy,” an economic symposium sponsored by the Federal Reserve Bank of Kansas City, Jackson Hole, Wyoming, 8/22/2025.
[2] Source: Bloomberg data, “World Interest Rate Probabilities”.
[3] Source: Bloomberg column by Simon White – MacroScope column titled “Stock Market Tops Look Quite a Lot Like This” dated 8/21/25.
[4] Source: Data from Goldman Sachs Weekly Kickstart dated 8/22/25.
[5] Source: Bloomberg column by John Authers titled “AI Holds Up the Sky. The Rest Fell Back to Earth” dated 8/19/25.
[6] Source: Market Returns reference the following indices: Large Cap – S&P 500, Mid Cap Growth – Russell Midcap growth, Mid Cap Value – Russell Midcap Value, Small Cap – Russell 2000, Developed – MSCI EAFE, Emerging – MSCI Emerging Markets, Aggregate – Bloomberg US Aggregate, High Yield – Bloomberg High Yield
OAI01335