

September 5, 2024 •Nathan Willis

August Review – The return of volatility
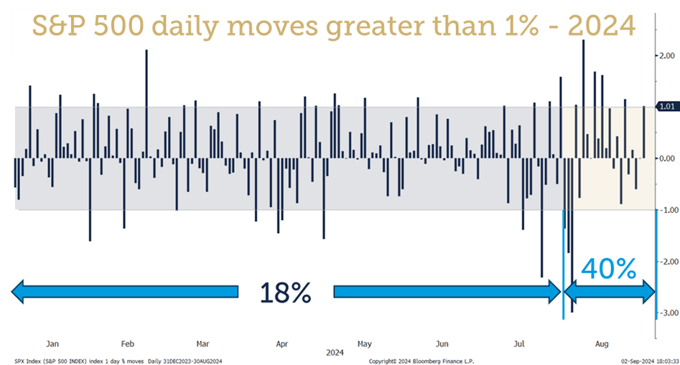
August started off with a bang, as concerns over the health of the US economy and the unwinding of the Yen carry trade triggered volatile swings in the markets. Volatility remained throughout the month as economic releases highlighted improving growth and inflation, and a generally strong – with one major caveat - earnings season. A major speech by Fed Governor Powell signalled a September rate cut, finishing the month on a positive note; this news triggerd a significant increase in market volatility compared to the first seven months of the year.
The chart below shows the increase: Through July, the S&P 500 moved more than 1% up or down on 18% of the 146 trading days. The market moved that much on 41% (9 of 22) trading days in August.[1]
The caveat to the strong earnings season was Nvidia, whose earnings growth was almost unheard of - earnings and revenue were both up 150% versus the same quarter last year. The stock reacted by falling over 6%. Why? Because expectations were even higher. We’ll talk more about expectations in the outlook section.

August Market Review
Returns were relatively tame despite the volatility throughout the month:
- Large cap stocks gained 2.4% and are up almost 20% for the year.
- Small and midcaps took a breather after a strong July, remaining well behind large caps for the year.
- International stocks joined the party this month as the dollar declined.
- Value stocks gained a bit of ground during the month, modestly closing the performance gap to growth stocks.
- Bonds rallied on the soft inflation news and Fed Chair Powell’s dovish comments near the end of the month.

Stock sector movements reflected the slowing inflation and dovish Fed:
- Interest sensitive sectors – Real Estate, Utilities, and Financials – led the way as the market perceived that interest rate cuts are imminent. These sectors are expected to perform well during a period of declining rates.
- Technology and communications were the only sectors in the red for the month, giving up a small portion of their strong YTD gains.
- Consumer staples and discretionary stocks managed to score slight gains despite growing evidence of strains in consumer balance sheets.
Our Navigator framework informs our outlook.
September 2024 Navigator Outlook
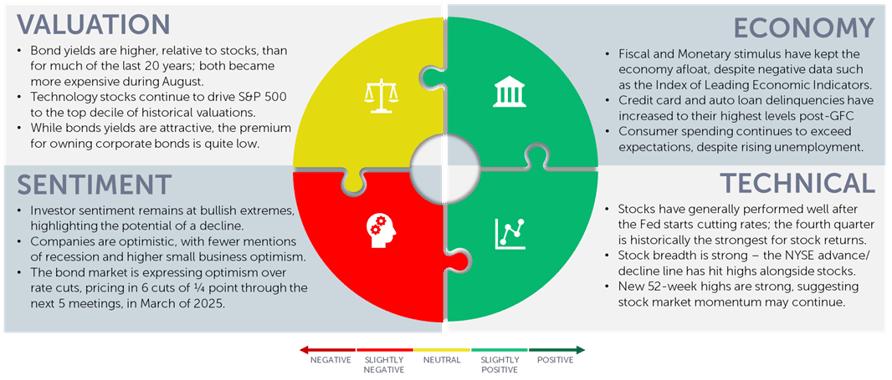
Economy: Fiscal and Monetary stimulus have kept the economy afloat, despite negative data such as the Index of Leading Economic Indicators, which is at a level which has usually signaled recession. Credit card and auto loan delinquencies have increased to their highest levels post-GFC, indicating there is some stress at the lower end of the consumer. Consumer spending continues to exceed expectations, despite rising unemployment.
Technicals: Stocks have generally performed well after the Fed starts cutting rates; the fourth quarter is historically the strongest for stock returns. Stock breadth is strong – the NYSE advance/decline line has hit highs alongside stocks. The number of new 52-week highs is strong as well, suggesting stock momentum may continue.
Sentiment: Investor sentiment remains at bullish extremes, highlighting the potential of a decline. Companies are optimistic, with fewer mentions of recession on S&P 50 earnings calls and higher readings of small business optimism. The bond market is expressing optimism over rate cuts, pricing in a total of 6 rate cuts (1.5% in total) over the next 5 meetings, through March of 2025.
Valuation: Bond yields are higher, relative to stocks, than they have been for much of the last 20 years; both, however, became more expensive during August. Technology stocks continue to drive S&P 500 to the top decile of historical valuations. While bonds yields are attractive, the premium for owning corporate bonds is quite low.
Outlook and Recommendations: Fully invested but flexible
The negative price reaction to Nvidia’s earnings highlights the risks that apply to the broad market from high stock valuations and extremely positive investor sentiment towards stocks.
The first chart to the right illustrates Federal Reserve data that show equities as a percent of investor portfolios. [2] Investors have never been as broadly exposed to stocks as they are now; if volatility spikes there is a risk that investors may reallocate, creating a negative feedback loop.
The second chart, from our recent webinar discussing small cap stocks, shows that large cap stocks have become a) far more expensive than international and small cap stocks b) more expensive than any time in the last 20 years except for 2021. [3]
Large cap stocks, heavily owned and trading at high valuations, are prone to increased volatility in the short term, and lower return expectations in the intermediate to long-term; valuations matter greatly for long-term returns. Small & Mid cap and international stocks, trading closer to their long-term average valuation levels, represent a compelling opportunity set for equity investors.
Portfolio Positioning
We are positioned accordingly to take advantage of these opportunities:
- We remain globally diversified, with significant allocations to SMID and International stocks and lower allocations to large cap US stocks.
- Our portfolios are skewed towards quality stocks, likely to hold up better if the US economy experiences a recession.
- Our bond portfolios have a relatively neutral maturity and credit profile; we are not making a major bet on fed rate cuts and have reduced high yield exposure.
- For those clients who prefer further diversification from both the stock and bond markets, we offer portfolios which utilize various hedged strategies to further manage short-term volatility.
Short-term losses are a fact of investing life; a disciplined plan will allow investors to take advantage of volatility. We encourage investors to remain prepared, calm, and fully invested, during both good times and challenging markets.
This material is intended to be educational in nature, and not as a recommendation of any particular strategy, approach, product or concept for any particular advisor or client. These materials are not intended as any form of substitute for individualized investment advice. The discussion is general in nature, and therefore not intended to recommend or endorse any asset class, security, or technical aspect of any security for the purpose of allowing a reader to use the approach on their own. Before participating in any investment program or making any investment, clients as well as all other readers are encouraged to consult with their own professional advisers, including investment advisers and tax advisors. OneAscent can assist in determining a suitable investment approach for a given individual, which may or may not closely resemble the strategies outlined herein.
[1] Source: Bloomberg, OneAscent Investment Solutions
[2] Source: Federal Reserve Bank of St. Louis Households and Nonprofit Organizations; Directly and Indirectly Held Corporate Equities as a Percentage of Financial Assets; Assets, Level (BOGZ1FL153064486Q) | FRED | St. Louis Fed (stlouisfed.org)
[3] Source: Bloomberg, OneAscent Investment Solutions – Data series includes: S&P 500 (S&P 500 index of large cap stocks), MSCI ACWI Ex-US (Morgan Stanley All Country World Ex USA index of non-US stocks), S&P 600 (S&P 600 index of small cap stocks)
OAI00932