

October 7, 2025 •Nathan Willis

September Review – Groundhog Day in Washington
Washington has given us yet another government shutdown; the September 30, midnight shutdown capped off a month in which the unexpected came to the forefront: The Fed lowered rates while remaining circumspect about the future, citing a balance of inflationary and labor market risks. GDP growth surprised to the upside, and stocks cheered the news with all-time highs throughout the month – a month which has a reputation for volatility. The month finished on a sour note, though, as the Conference Board measure of consumer confidence dropped, with the present situation index lower than all but one month since the the 2021 COVID recovery. Payroll data from ADP also showed a decline in employment when an increase was expected.
Despite the pending shutdown, mixed data and plenty of political turmoil, stocks did quite well in September. Perhaps the market is looking beyond the shorter term shutdown risks. The chart to the right shows that, in general, the market has done quite well in the months following a government shutdown.[1] We’ll suggest another couple of reasons for the strong returns – and future optimism – in the outlook section, but first lets review the details of September performance.
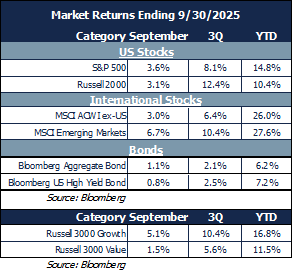
September Market Review
Stocks advanced for the fifth straight month as the Fed’s rate cut spurred optimism:
- Emerging markets led the way, driven by technology gains and stimulus in China.
- Developed markets continued their winning ways, bringing YTD gains above 25%.
- US stocks responded positively to rate cuts, as both large and small stocks advanced.
- Bonds gained as weaker employment data bred optimism for further rate cuts.
The year’s winners drove September performance:

- Technology and communications services led the way in both September and YTD.
- Utilities have performed well based on expectations for power needs for the AI buildout
- Consumer discretionary performed well in September as declining interest rates supported spending. The sector is a laggard for the year as the employment picture remains cloudy.
- Across sectors and market capitalization growth outperformed this month, and is ahead YTD.
Our Navigator framework informs our outlook.
October 2025 Navigator Outlook
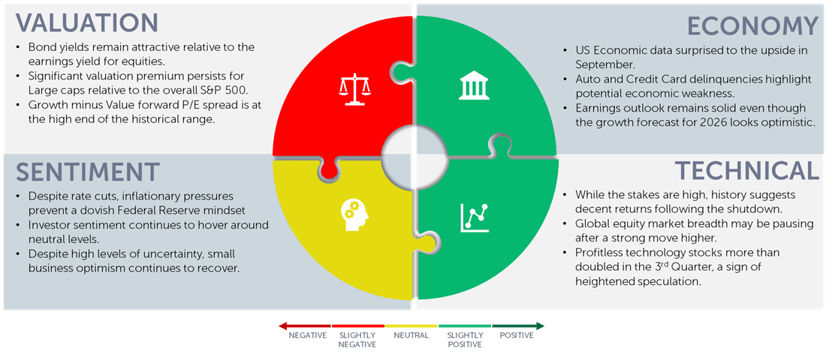
Economy: US Economic data surprised to the upside in September, but auto and credit card delinquencies highlight potential areas of economic weakness. The outlook for earnings remains solid even though growth forecasts for 2026 look overly optimistic.
Technicals: While the stakes are high in the current government shutdown, history suggests decent returns will follow. Global equity market breadth may be pausing after a strong move higher. Meanwhile. Profitless technology stocks more than doubled in value during the 3rd Quarter, a sign of heightened speculation.
Sentiment: While the Fed recently cut rates, inflationary pressures are preventing the Fed from adopting an overly dovish mindset. Investor sentiment continues to hover around neutral levels. Despite rising uncertainty, small business optimism continues to recover.
Valuation: Bond yields remain attractive relative to large cap stocks’ earnings yield, but a significant valuation premium persists for the largest stocks relative to the broad market where attractive opportunities remain. Additionally, the growth-to-value Price/Earnings spread remains at high end of its historical range.
Outlook and Recommendations: Reasons for optimism and concern
We’re inundated with daily headlines proclaiming the transformative potential of artificial intelligence. It’s easy to get swept up in the excitement—or to reflexively compare today’s environment to the dot-com bubble. Both reactions deserve thoughtful consideration.
 Many investors liken the rise of the AI economy—personified by ChatGPT—to the emergence of the internet era. ChatGPT launched on November 30, 2022. How do market returns since then compare to those following the release of Netscape Navigator in October 1994? The chart to the right offers perspective: the NASDAQ surged 10x from Netscape’s debut to its March 2000 peak before collapsing. Since ChatGPT’s release, the NASDAQ has “only” doubled. If history rhymes, we may still be in the early innings of the AI revolution.[2]
Companies are investing heavily to keep pace with the AI boom. Microsoft is projected to spend $62 Billion on capital expenditures in 2025, more than triple its 2020 outlay.  These are tangible dollars from a mature business, signaling real economic activity. When paired with an accommodative Federal Reserve and expansive fiscal policy, this wave of tech-driven investment supports a constructive near-term economic outlook.
A historical review of technology sector performance around the dot-com era is instructive. The chart to the right breaks it into three phases: the five years post-Netscape, the subsequent five years, and the full decade. Tech stocks delivered over 50% annualized returns in the late ’90s, only to lose 16% annually from 2000 to 2004. Over the full ten-year cycle, technology landed squarely in the middle of sector performance[3].  Chasing momentum in the late ’90s didn’t pay off—and we believe the same caution applies today.
At OneAscent, we emphasize long-term investing. While valuation may have limited predictive power in the short run, it’s a powerful tool for long-term allocation. Recent AI-related announcements—like Nvidia’s $100 billion investment in OpenAI (which will, notably, fund purchases of Nvidia hardware)—have driven tech valuations sharply higher.
 Free Cash Flow (FCF), defined as cash flow after capital expenditure, is especially relevant in this environment. From 2010 to 2020, tech stocks were reasonably valued relative to the broader market. But since ChatGPT’s release, tech valuations have surged while the rest of the market has remained near historical norms. One reason: FCF is falling as companies enter a capex arms race to meet AI demand.
We don’t know how the AI boom will end, but capital spending booms typically leave some companies – those who over-spend – out in the cold.
We think it makes sense to invest according to long-term return expectations, not just current momentum. Let’s talk about where we see opportunities.
Portfolio Construction and Positioning
The combination of supportive fiscal policy and recent rate cuts has helped propel the S&P 500 higher. Yet beneath the surface, risks remain. Softening employment data and rising delinquencies in subprime auto loans and credit cards point to potential cracks in consumer health. Inflationary pressures and growth concerns continue to coexist, requiring thoughtful portfolio positioning.
In this environment, we believe investors should look beyond the concentrated leadership of U.S. megacap technology stocks. Valuations in other areas of the market remain compelling, and we’ve positioned portfolios accordingly.
Our Navigator process helps guides both short- and medium-term tactical adjustments:
- Mid-cap and international equities: These segments offer attractive valuations relative to U.S. large caps and provide diversification benefits.
- Balanced exposure across styles: We maintain a mix of growth stocks poised to benefit from technological innovation and value stocks offering upside potential and, in many cases, strong dividend profiles.
- Fixed income remains compelling: Bond yields exceed the earnings yield of large-cap equities, and real (inflation-adjusted) yields are positive—supporting the case for continued fixed income exposure.
- Mortgage-backed securities: We see favorable risk-reward dynamics here, though tight corporate credit spreads warrant caution.
- Alternative investments: We continue to find meaningful opportunities in both non-correlated strategies and private market investments.
Our goal is to build portfolios that are resilient and capable of compounding effectively over time. While risks remain, the strong rally since the April lows proves again the value of discipline and diversification.
This material is intended to be educational in nature, and not as a recommendation of any particular strategy, approach, product or concept for any particular advisor or client. These materials are not intended as any form of substitute for individualized investment advice. The discussion is general in nature, and therefore not intended to recommend or endorse any asset class, security, or technical aspect of any security for the purpose of allowing a reader to use the approach on their own. Before participating in any investment program or making any investment, clients as well as all other readers are encouraged to consult with their own professional advisers, including investment advisers and tax advisors. OneAscent can assist in determining a suitable investment approach for a given individual, which may or may not closely resemble the strategies outlined herein.
[1] Source: Edward Jones: Weekly Stock Market Update | Edward Jones
[2] Source: Bloomberg, OneAscent Investment Solutions – the chart goes through the trough of the bursting of the NASDAQ in October of 2002.
[3] Source: Bloomberg
[4] Source: Market Returns reference the following indices: Large Cap – S&P 500, Mid Cap Growth – Russell Midcap growth, Mid Cap Value – Russell Midcap Value, Small Cap – Russell 2000, Developed – MSCI EAFE, Emerging – MSCI Emerging Markets, Aggregate – Bloomberg US Aggregate, High Yield – Bloomberg High Yield
OAI01343