

December 12, 2022 •Nathan Willis

Evaluating the rally
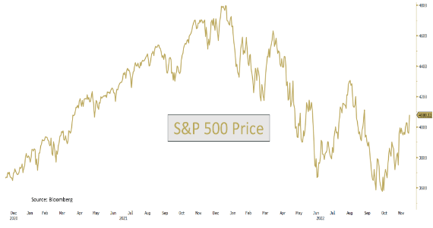 The market touched a new low in October and produced a strong rally for the rest of the month, and this positive performance continued throughout November. It is helpful to look at November’s stock market returns in the longer context. A two-year chart of the S&P 500 helps illustrate the tensions among market participants today. Some analysts point to the market bottoming in June and then again in October, suggesting that the bear market is over and blue skies are ahead.
Others look at the same chart and see a market peak at the beginning of the year, a lower peak at the end of March, another lower peak in August, and the current peak at the end of November. These analysts suggest that such a series of lower lows and lower highs indicates a bear market with further weakness ahead.
We see validity in both approaches. More important, though, is the fact that too much focus on short term market gyrations tends to take our focus off the important work of investing for the long term.
Inflation With the long-term in mind, its important to discuss what has driven recent fluctuations and what they say about the future. We have written extensively this year about how inflation expectations caused interest rates to spike, which caused stocks and bonds to sell off, which caused the worst balanced portfolio performance in decades. In fact, this is the worst bond market since the middle of the 19th Century![1]I will spare you the pain of looking at a chart that shows how much bonds have lost this year.
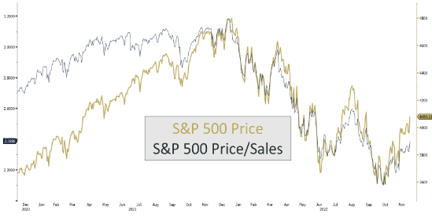
What I will do, however, is talk about the economy and, by extension, corporate profit growth. The risks have shifted from inflation to recession, driven by the Federal Reserve’s intense focus on stomping out inflation. Their inflation focus may keep rates higher for longer, thereby driving the US economy into a recession. If we look at the same two-year chart of the S&P 500 and include the Price/Sales ratio – a measure of how expensive the stock market is relative to the revenues the companies earn – it can help us see how the dynamics have changed this year, and that may give some insight into the future.
As the market roared in 2021, the Price/Sales ratio (in blue) rose less aggressively than stocks. However, as inflation took hold and caused stocks to sell off, the Price/Sales ratio fell roughly the same as stocks. As earnings estimates held steady the ratio stayed relatively even with the stock market. However, today’s concern is margin pressures. Inflation in costs of goods and employment is eating away at corporate profits, and this trend looks to continue. This puts future profits at risk, which puts market returns at risk.
November Market Review
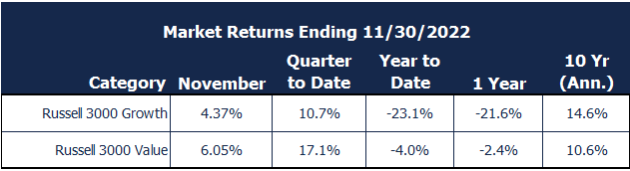
The S&P 500 gained 5.6% during November. There are a couple of other return numbers to note in the chart below. Mid-cap stocks performed a bit better while small-cap companies lagged but still made money. Bonds performed well as market participants began to sense that the Fed may reduce the speed of rate hikes.
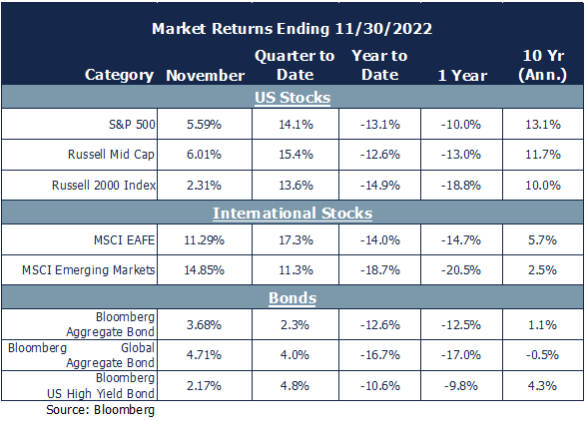
Meanwhile, international markets surged. International stocks, represented by the MSCI EAFE, gained 11.3%, vastly outperforming the US markets, and emerging markets performed even better, up just shy of 15%.
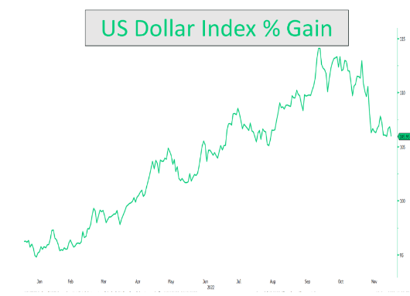 One significant driver of international returns was weakness in the US Dollar. Returns from overseas were roughly 3% higher when translated back into dollar. This sharp move was a reversal of a strong year-to-date trend, as seen in the chart on the left. The dollar’s weakness may be related to the market’s perception of a less aggressive Federal Reserve.
During October, value stocks outperformed growth stocks significantly, continuing the trend that started a year ago. Over the last year, the Russell 3000 Value index is down only 4%, while the Growth index is down over 23%, reflecting the increased discounting of future earnings. This is a notable change from the long-term (10-year) returns shown in this month’s performance charts.
Review of our Navigator Outlook
Valuation:Stock valuations have increased as markets recovered by double digits from the October lows. Currently the S&P 500 has recovered while forward earnings estimates have declined since peaking in the summer.[2]Valuations are as high as the ‘pre-pandemic’ peaks.
As we cast a wider net than US large cap stocks, we find more attractive valuations. Small and mid-cap, international, and emerging
markets stock valuations are more attractive than those of US stocks. SMID and emerging markets stocks are both trading at or below their average valuations over the last 10 years.
The key question, however, remains: Will companies be able to maintain their earnings power (profit margins) if we enter a recession?
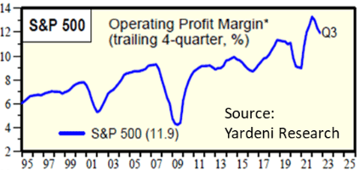
Economy: Profit margins depend upon a strong economy and strong consumer. The economic data on these fronts is a mixed bag. Employment is strong, and the consumer is spending. However, inflation is higher than the Federal Reserve desires, yet there are signs inflation has peaked. How far and how fast it declines, though, may determine trajectory of interest rates and the economy. Fear of an over-aggressive Fed (and other central banks across the globe) may create a self-fulfilling prophecy, driving us into a recession. This would further hurt profit margins, which have already declined for the last several quarters.[3]
Technicals: Short-term technical indicators are at a crossroads. Some gauges, like moving averages and market breadth, have risen strongly and suggest the potential for a pullback. However, the Put/Call ratio indicates overly bearish positioning of options traders, which can indicate the potential for a sharp rise in stocks. Long-term technicals are not all positive, but there are some good signs. Market breadth is stable, even if barely weakening, and the very long-term (200-week) moving average acted as a technical support level in October and remains a solid long-term support.
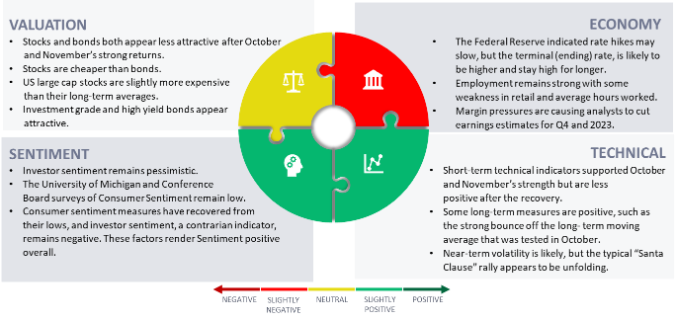
Sentiment: Investor sentiment has been negative since the summer, and we are wise to view it as a contrarian indicator. Measures of consumer confidence appear to have recovered some from very negative readings, rendering sentiment positive in the short-term.
Outlook: Continued Volatility and a ‘Santa Claus’ rally?
The short-term outlook is slightly murky given the strong returns of October and November; the markets often pause after such a strong period of returns. At the same time, the potential for a Santa Claus rally remains. December has historically been the best month in the stock market, and often those returns include a strong rally around the Christmas holiday.
Portfolio recommendations
Even after two strong months there may be upside in the markets. We recommend investors take the following actions:
- Maintain your plan: Pay no attention to factors that don’t affect your long-term returns.
- Maintain discipline: At the same time, pay attention to investments which may be at risk if the economy goes into recession. Move toward a more even balance between your allocation to growth and value stocks. Evaluate risk in your portfolio and use the market’s rise to rebalance if the ride has been too volatile this year.
- Talk to your adviser about alternative assets and whether they may be right for you. Alternatives often have low correlation to the traditional markets and have different drivers of return.
[1] Source: Wall Street Journal It’s the Worst Bond Market Since 1842. That’s the Good News. - WSJ
[2] Source: FactSet Earnings Insight
[3] Source: Yardeni Research Inc. S&P 500 Sectors & Industries Profit Margins (yardeni.com)
This material is intended to be educational in nature, and not as a recommendation of any particular strategy, approach, product or concept for any particular advisor or client. These materials are not intended as any form of substitute for individualized investment advice. The discussion is general in nature, and therefore not intended to recommend or endorse any asset class, security, or technical aspect of any security for the purpose of allowing a reader to use the approach on their own. Before participating in any investment program or making any investment, clients as well as all other readers are encouraged to consult with their own professional advisers, including investment advisers and tax advisors. OneAscent can assist in determining a suitable investment approach for a given individual, which may or may not closely resemble the strategies outlined herein.
OAI00090