

July 2, 2024 •Nathan Willis

June Review – A Political Narrative Ends While an Economic Narrative Continues
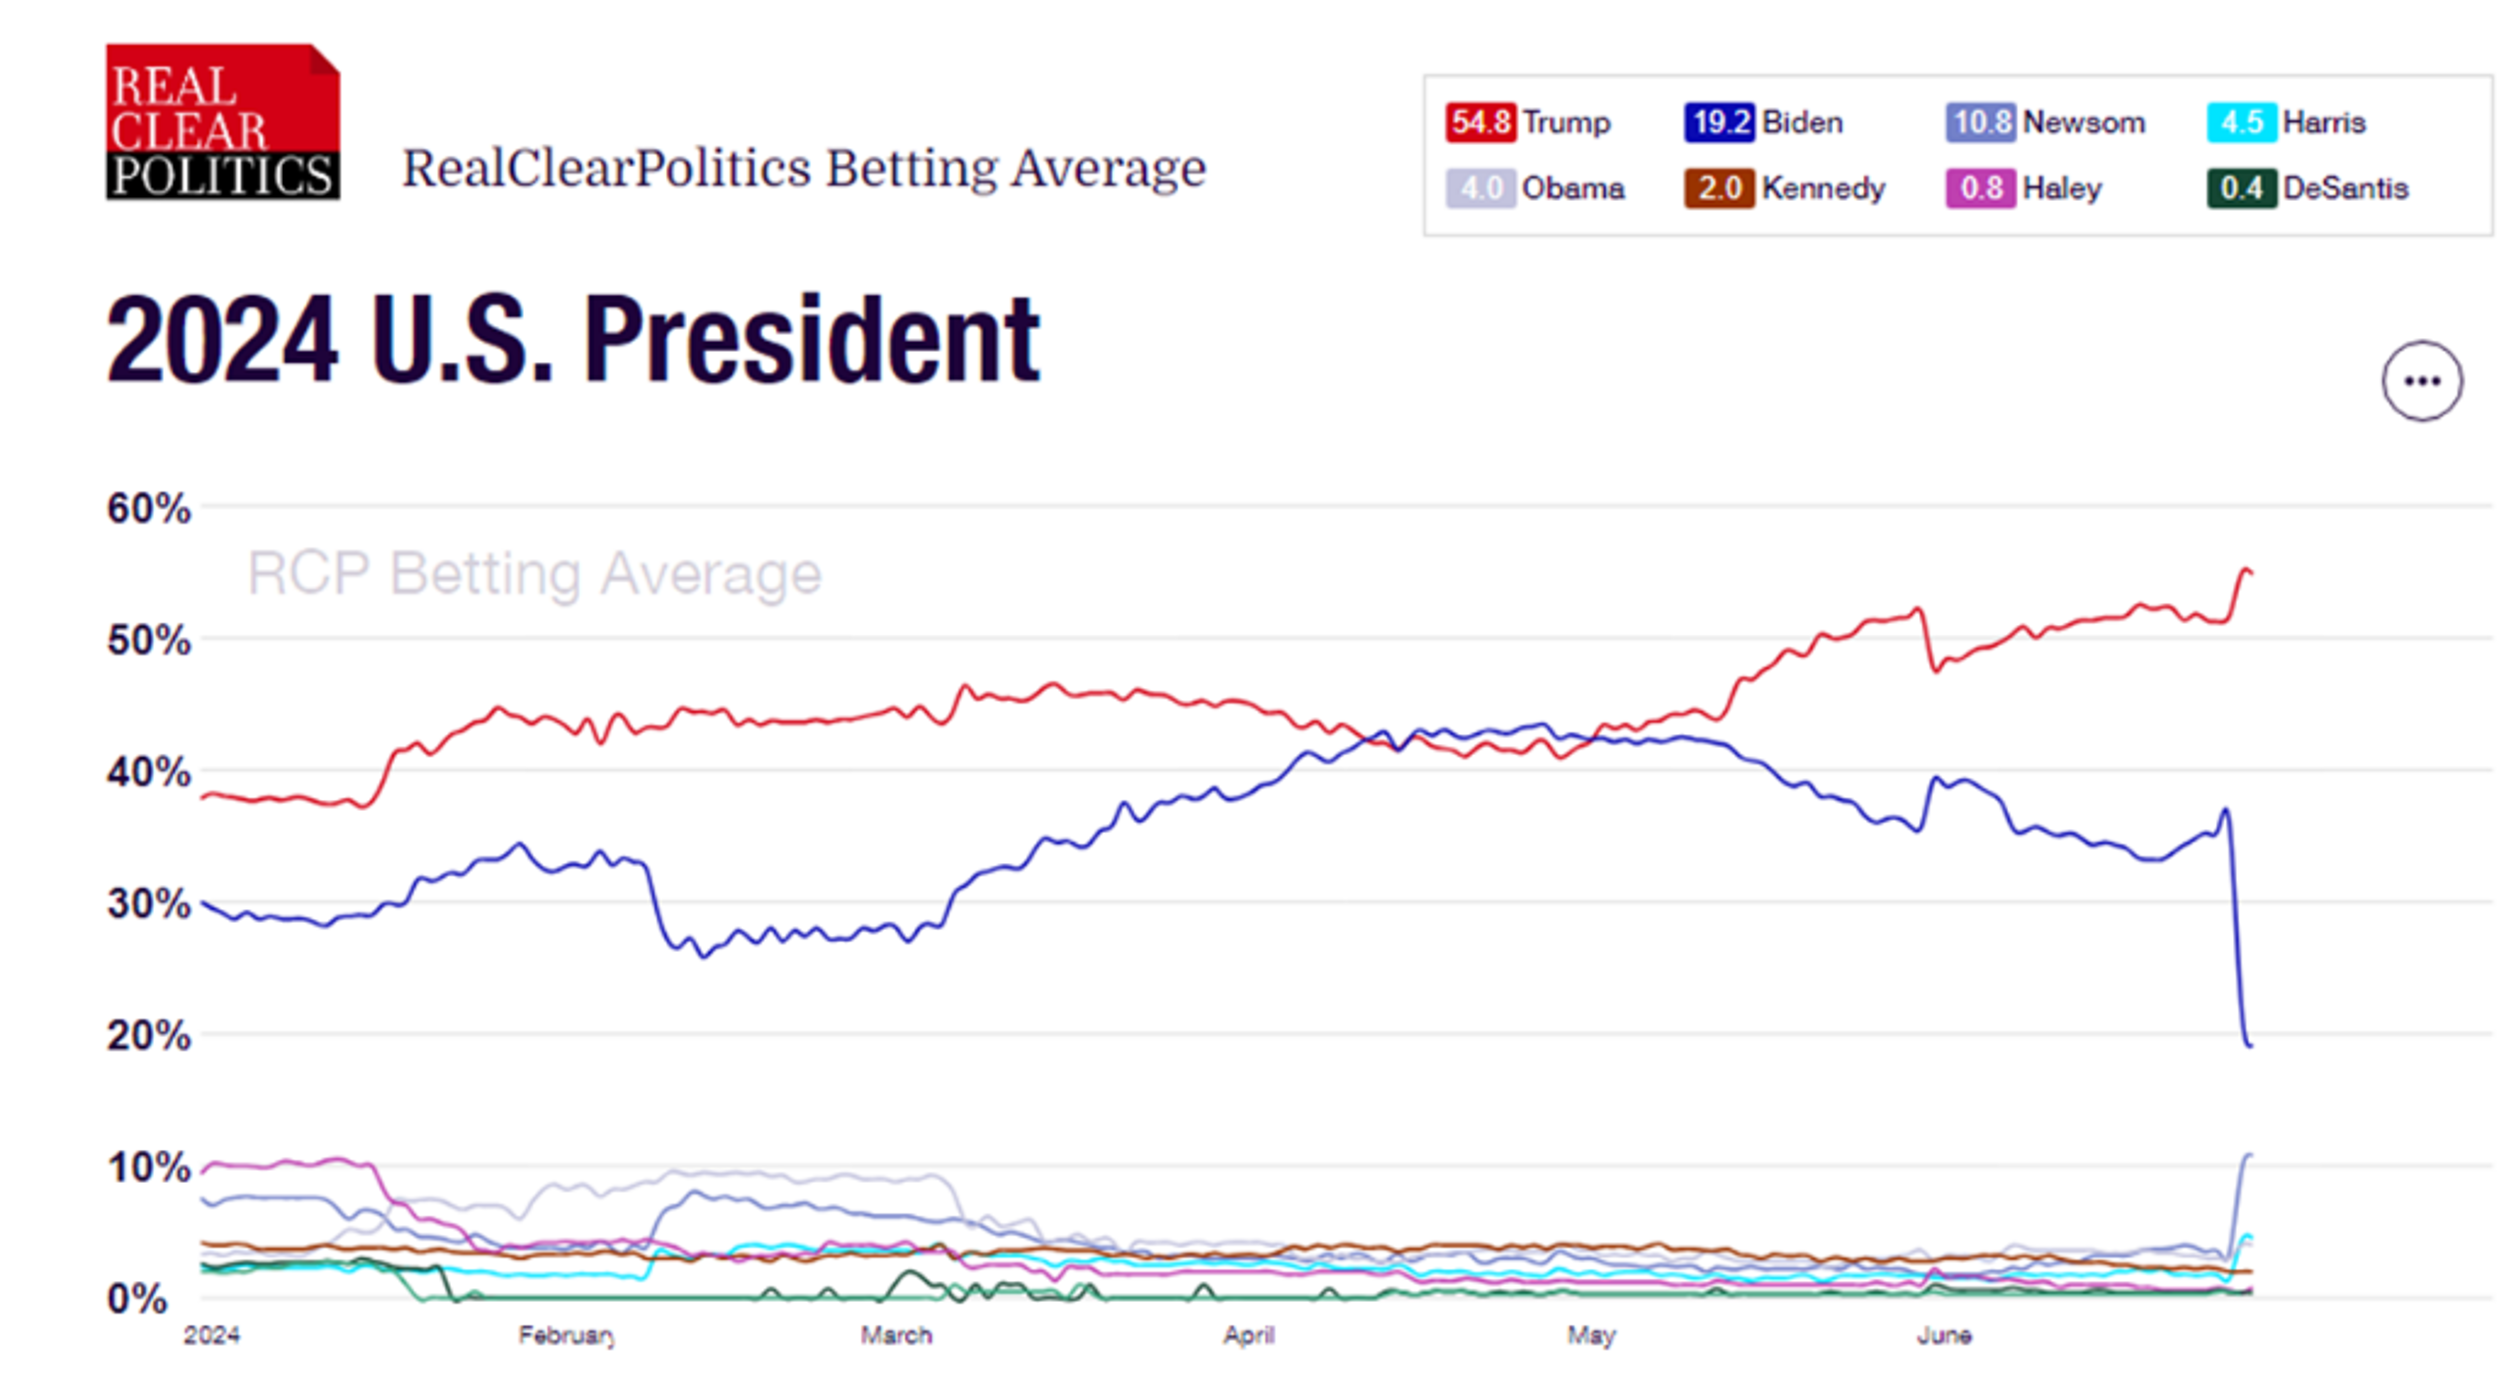
Regardless of your politics, the June Presidential debate was not America’s finest hour. The aftermath was dominated by speculation over Democrats’ likelihood of finding another candidate. Trump’s odds went up slightly, while odds for the next most likely Democrat, Gavin Newsom, significantly increased.[1] We’ll talk more about what this means for the markets in the outlook section.
While the narrative underpinning the Biden reelection campaign appears headed toward an ignominious end, the market’s preferred narrative of a soft landing is alive and well. June’s economic data was, on the whole, positive: While Fed Governor Powell was cautious about when rate cuts would start and Fed speakers have delivered a generally cautious message in public remarks, inflation data softened during June. Several measures of economic growth appear to be trending down, but, for now, not down too much; the Fed should be able to cut rates later this year and forestall a recession.
This is is the preferred market narrative because if it’s not true, the S&P 500 is probably overvalued: earnings will drop during a recession, or inflation will again rear its ugly head, hitting stock valuations.
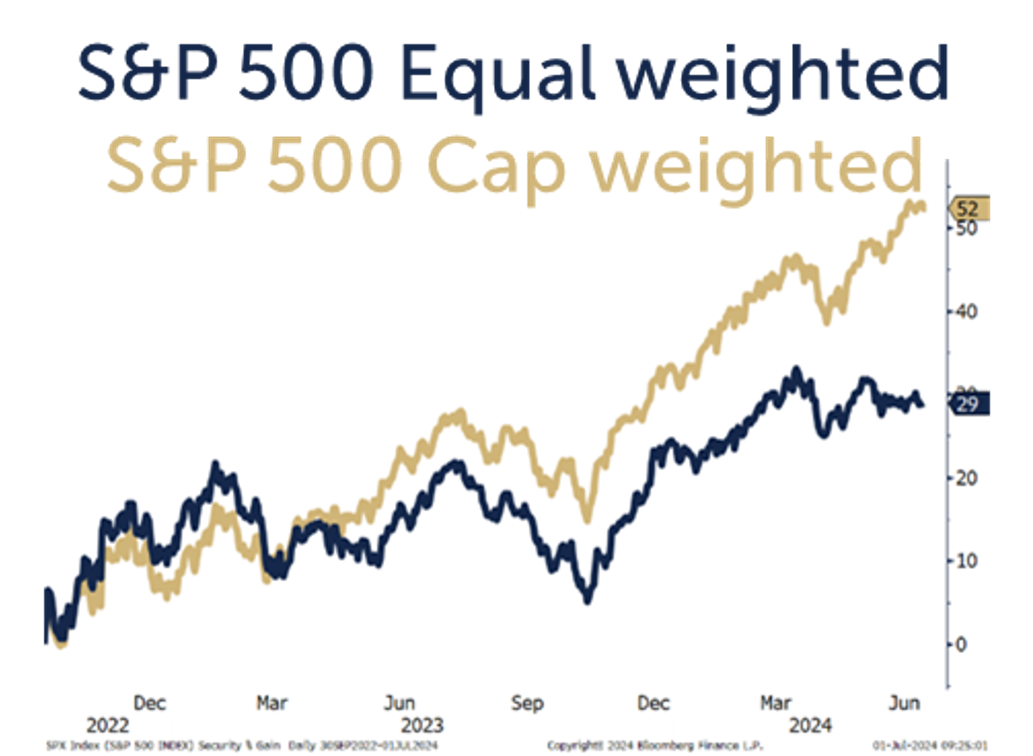
June also saw more dominance by the largest names. The broad market performed well coming off the bottom in 2022, but the AI narrative has driven the mega cap names relentlessly higher for the last year; this narrow performance suggests the rally is on shaky ground.[2]
Which narrative is true? Before we talk about what’s next, let’s review June’s returns.
June Market Review
One of the most significant items of note is that the equal-weighted version of the S&P 500 lost money during the second quarter, while the capitalization-weighted index gained over 4%. This is rare – in fact, the equal weight index has lost money while the capitalization-weighted index gained in only 8 quarters since 1990, and this instance is the largest of those losses. The next closest was in 3Q 2007, the last quarter of gains before the Global Financial Crisis, when the S&P was up 1.56% for the quarter while the equal-weighted index lost 2.3%.
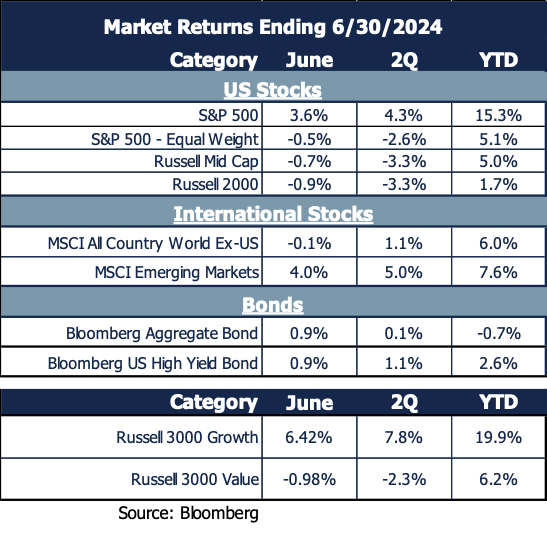
Highlights of June's strong performance:
- Tech stocks drove large cap stocks higher while small companies fell.
- International stocks lagged except for emerging markets.
- Bonds continued May’s rally as economic data cooled just enough, but not too much, for the Fed to lower rates and avoid a recession.
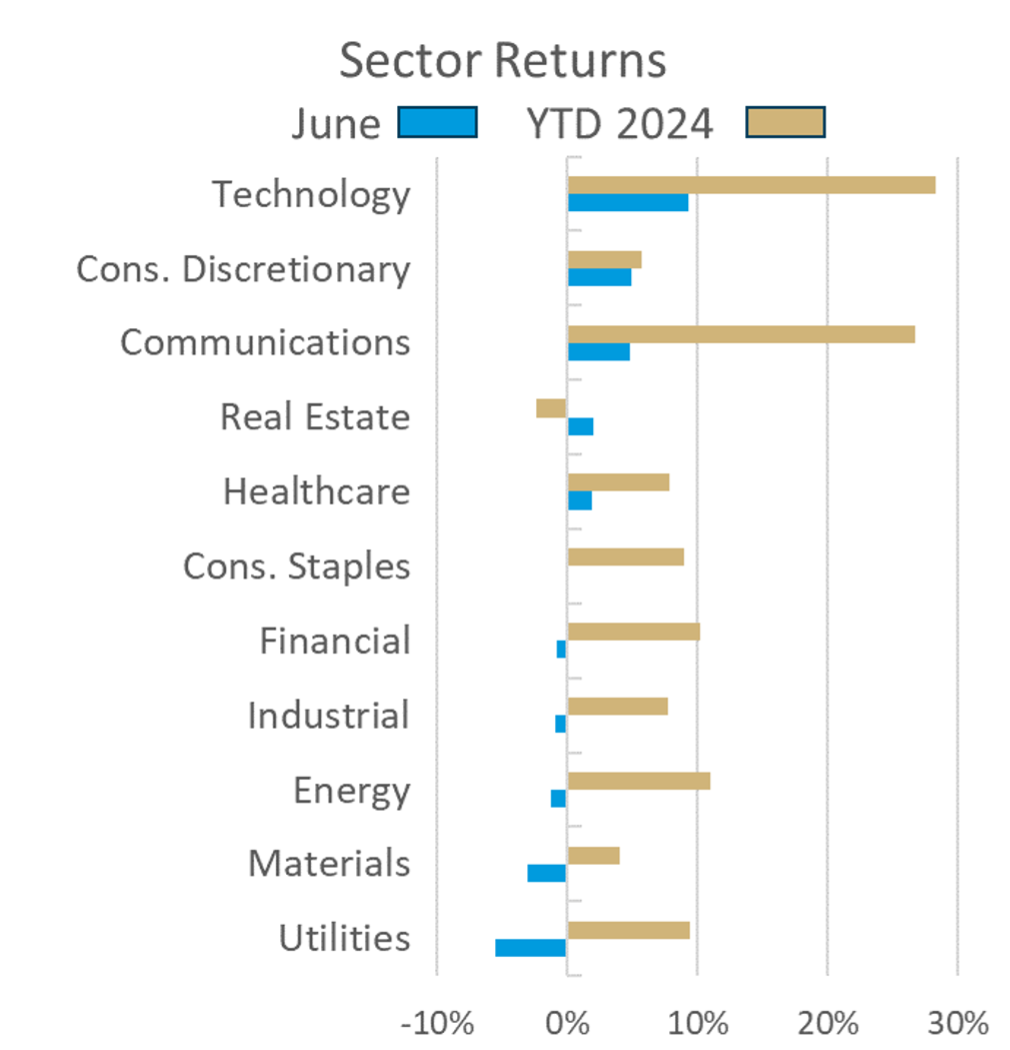
Stock sector movements reflected a mostly risk-on mindset:
- Technology and communications were winners for the month and the year.
- While the Consumer Discretionary sector gained in June, it has lagged most sectors for the year.
- Utilities were the losers of note in June, although they have held on to strong gains for the year.
Our Navigator framework informs our outlook.
July 2024 Navigator Outlook
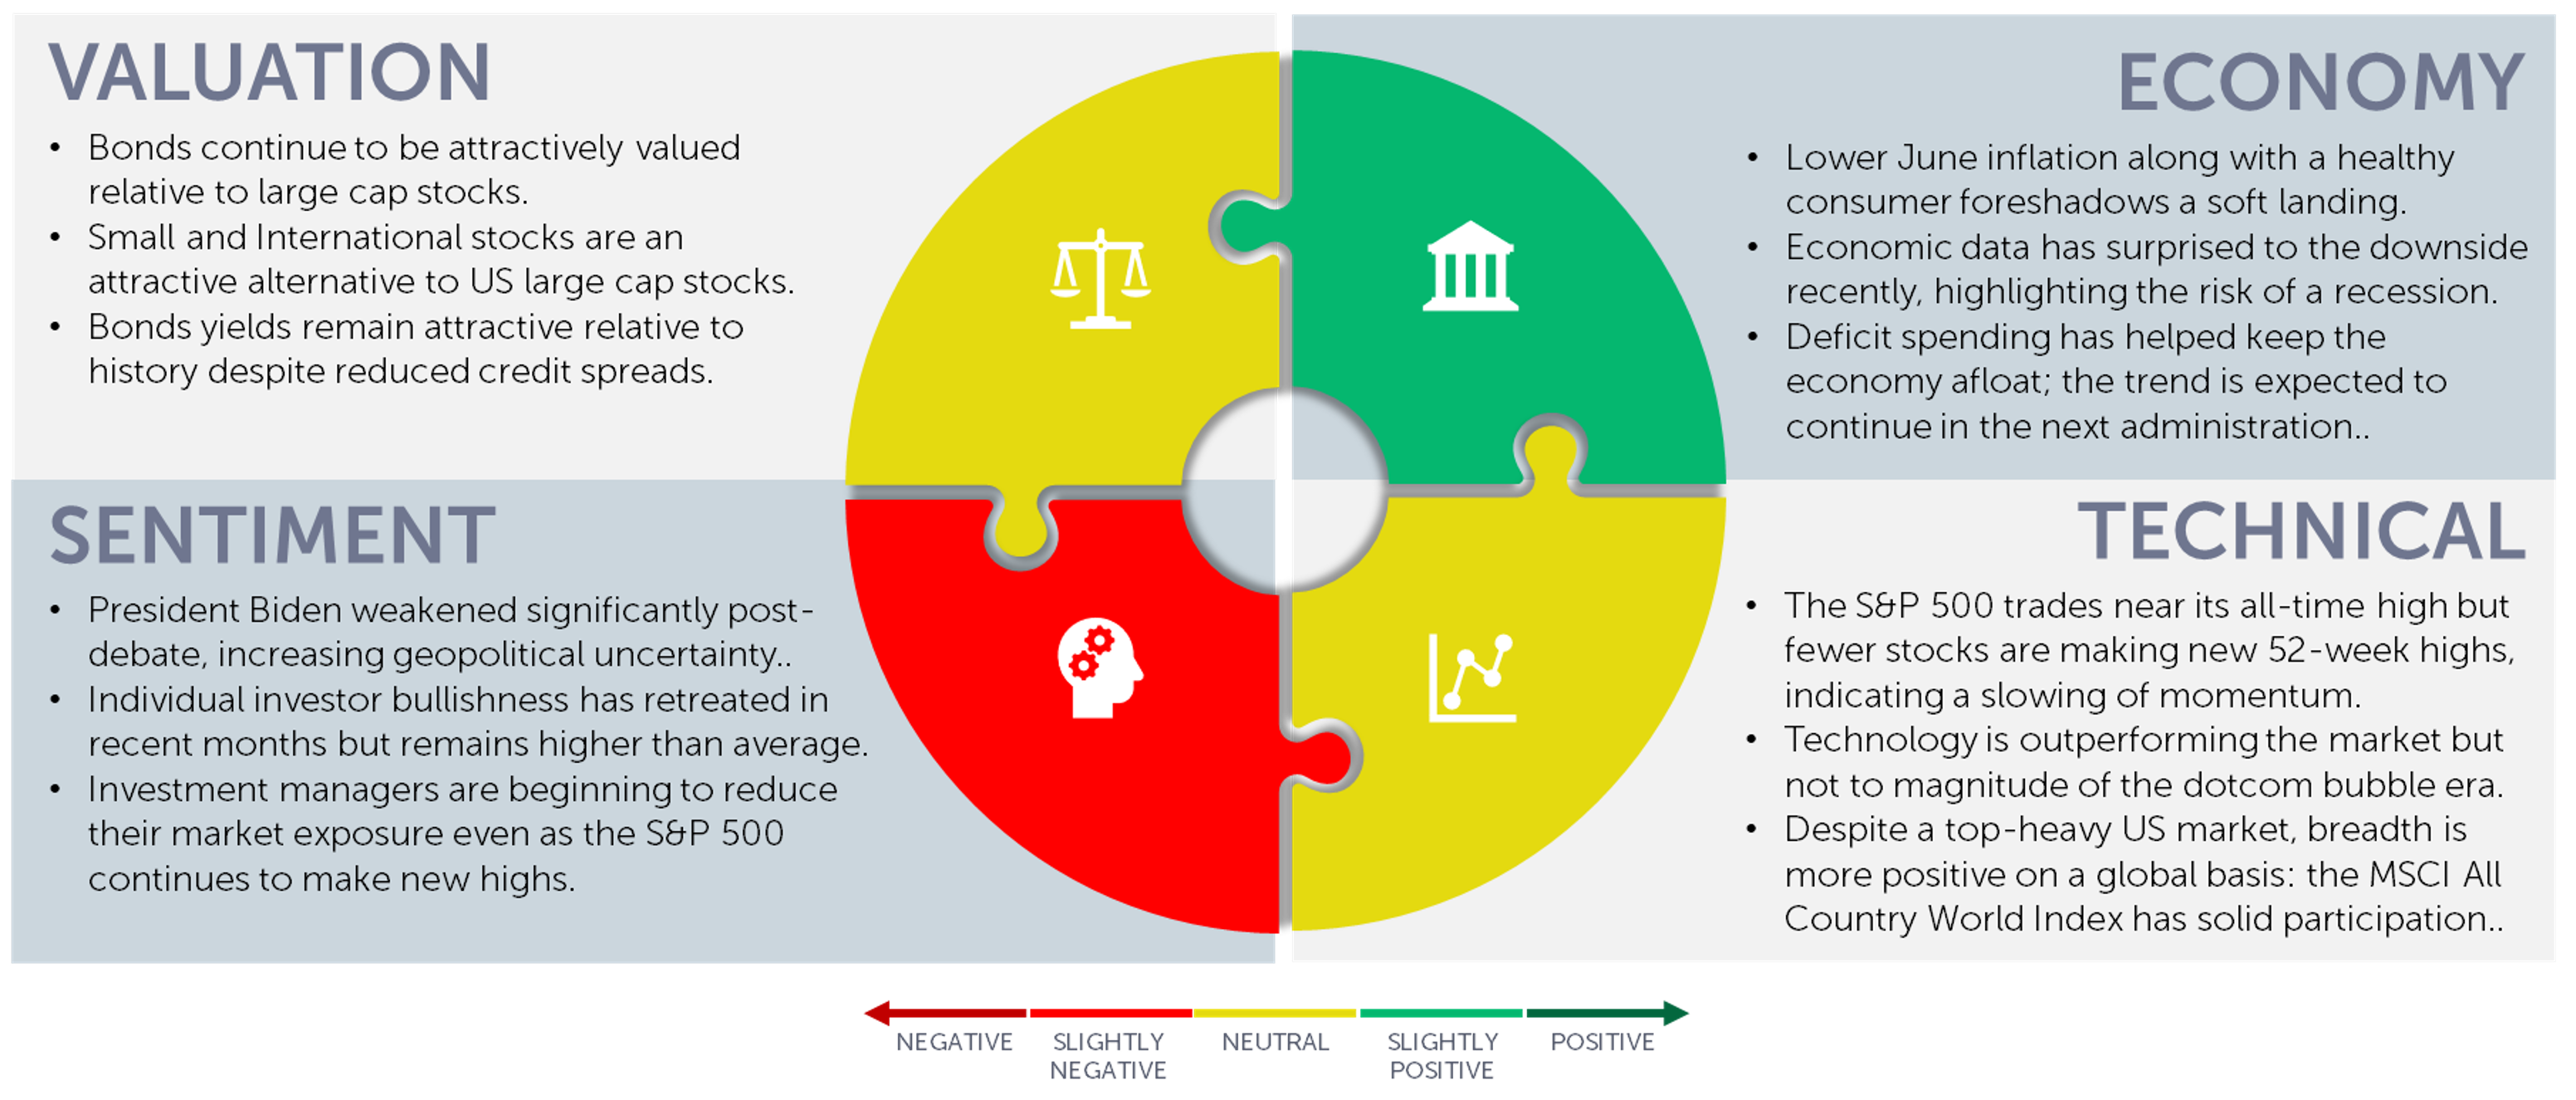
Economy: Lower June inflation along with data showing the consumer appears healthy foreshadows a soft landing. Economic data, though, has surprised to the downside recently, highlighting the increased risk of a recession. Deficit spending has helped keep the economy afloat; the trend is expected to continue in the next administration.
Technicals: The S&P 500 trades near its all-time high but fewer stocks are making new 52-week highs, indicating a slowing of momentum. The top ten stocks are 37% of the S&P 500 but contribute only 27% of their earnings. Technology is outperforming the market but not to the magnitude of the dotcom bubble era. Despite a top-heavy US market, breadth is more positive on a global basis: the MSCI All Country World Index has solid participation.
Sentiment: President Biden’s polling numbers weakened significantly post-debate, increasing geopolitical uncertainty. Individual investor bullishness has retreated in recent months but remains higher than average. Investment managers are beginning to reduce their market exposure even as the S&P 500 continues to make new highs.
Valuation: Bonds continue to be attractively valued relative to large cap stocks. Small and International stocks are an attractive alternative to US large cap stocks. Bond yields remain attractive relative to history despite reduced credit spreads.
Outlook and Recommendations: Will the Soft Landing Turn Into a Hard Landing?
The allure of a soft landing that drove returns in the first quarter has waned somewhat but remains the market’s base case. Our outlook and investment positioning are guided by the data:
- Market-based data is very positive: Bond spreads and measures of market volatility are low; the market seems content. However, an inverted yield curve has always preceded a recession; the curve has been inverted for two years.
- Survey-based measures present a mixed picture: while inflation expectations are decreasing and CEOs express cautious optimism,[3] small business owners remain pessimistic.[4] Consumer optimism lags significantly behind pre-pandemic levels.[5] Analysts forecast robust earnings for both 2024 and 2025.
- Economic data shows signs of softening: The Citi Economic Surprise Index indicates worse-than-expected data throughout the second quarter. Job openings are in decline and the unemployment rate is in danger of rising towards a level that suggests imminent recession.[6]
- Election wild card: The market has experienced both a Biden and Trump presidency, but a “non-Biden” ticket would lead to volatility in the fall.
We continue to believe that while a soft landing is the market’s base case, a recession is a distinct possibility. Likewise, we need to watch closely for signs that inflation is on the rise. Despite (or perhaps because of) the market’s positive mood, we have surpassed Wall Street’s full-year price targets[7] and the S&P 500 P/E ratio stands at 21x, near the January 2022 high.[8] With less potential for P/E expansion going forward, earnings growth will be essential to stock performance.
Portfolio Positioning
Amidst these risks we see numerous opportunities and are positioned accordingly:

- We favor small and midcap stocks, along with a full allocation to international equities. These areas of the market are less exposed to the high P/E ratios of the mega cap stocks and could outperform if market leadership broadens.
- Our focus within small and mid-cap exposure is on quality growth, a segment which is anticipated to continue performing well despite a slowing economy.
- This year we have increased our small cap exposure, anticipating benefits from either declining rates or sustained strong growth.
- Given the decline in yield premiums, we have trimmed our high yield exposure.
This material is intended to be educational in nature, and not as a recommendation of any particular strategy, approach, product or concept for any particular advisor or client. These materials are not intended as any form of substitute for individualized investment advice. The discussion is general in nature, and therefore not intended to recommend or endorse any asset class, security, or technical aspect of any security for the purpose of allowing a reader to use the approach on their own. Before participating in any investment program or making any investment, clients as well as all other readers are encouraged to consult with their own professional advisers, including investment advisers and tax advisors. OneAscent can assist in determining a suitable investment approach for a given individual, which may or may not closely resemble the strategies outlined herein.
[1] Source: Real Clear Politics 2024 U.S. President (realclearpolling.com)
[2] Source: Bloomberg, OneAscent Investment Solutions. The market has not been this concentrated since the 1997-1999 period leading up to the Dotcom crash.
[3] Source: The Conference Board US CEO Confidence (conference-board.org)
[4] Source: National Federation of Independent Business SBET-May-2024.pdf (strgnfibcom.blob.core.windows.net)
[5] Source: The Conference Board US Consumer Confidence (conference-board.org)
[6] Bureau of Labor Statistics
[7] Source: Yahoo finance What analysts are saying about Wall Street's 2024 outlook (yahoo.com)
[8] Source: JP Morgan
OAI00825