

September 10, 2021 •OneAscent

Overall Risk-Taking Score
 |
|
We monitor the backdrop for investing in risk assets across three primary pillars: economic conditions, asset prices, and technical considerations such as investor sentiment and price momentum. Since last month, our assessment of the environment for accepting investment has not materially changed. The economy remains healthy on average; households are in good financial shape, seeing wage gains, and spending. The labor market is improving, and financial conditions are quite accommodative. Risk asset classes such as equities and credit are trading above long-term averages, which is the primary factor holding back the overall risk-taking score. We are actively monitoring potential headwinds to US economic growth such as the COVID-19 delta variant, inflation, supply chain gaps, and potential tax increases. Given current conditions, we advocate investors:
- Trim exposure to risk assets such as equity and credit back to target weights after rallies.
- Position toward higher quality companies with less-cyclical revenue and earnings.
- Add strategies that may be less sensitive to above-average inflation or even profit from it.
- Add alternative strategies that are less correlated to traditional stock and bond markets.
- Favor actively managed funds as these tend to add the most value during inflection points in the market relative to their index-based counterparts.
Economy
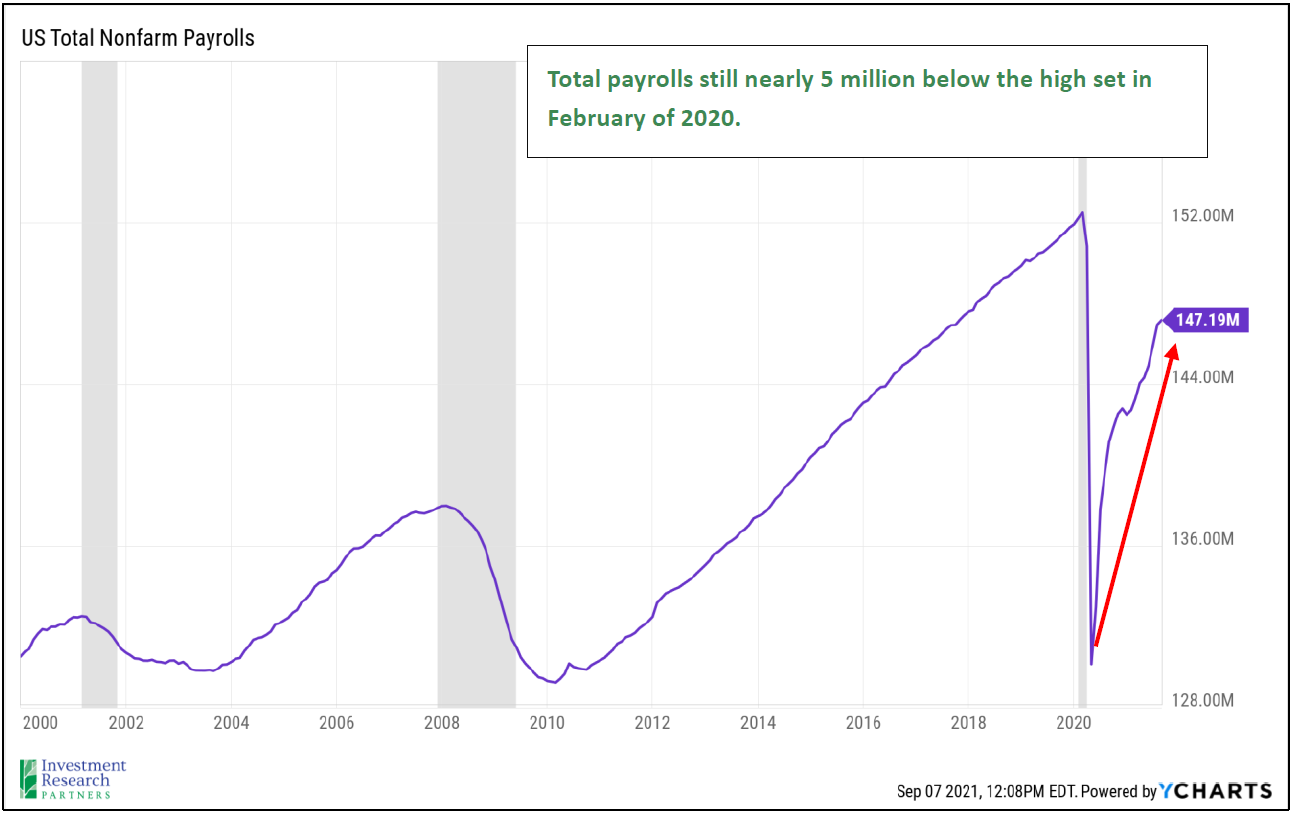
The US labor market continues to improve, though the pace of hiring significantly slowed in August as just 235,000 net new jobs were added (the economy had been adding roughly 600,000 jobs per month on average for 2021), and the headline unemployment rate declined by 0.2% to 5.2%.
During last week’s annual Federal Reserve Symposium in Jackson Hole, Wyoming, Chair Jerome Powell held a press conference where he communicated that the central bank intends to begin reducing its $120 billion per month bond buying program by year-end (a tool used by the Fed to push down long-term interest rates and provide liquidity). He also remarked that “there is much ground to cover” with respect to the economic recovery before the Fed intends to begin increasing its benchmark interest rate, which is currently anchored near zero (another tool utilized by the Fed to promote liquidity and increase economic growth). Mr. Powell implied that the group of monetary policy makers were hoping to see an economy near full employment again before increasing short-term interest rates, but the group’s ability to maintain this accommodative policy will be contingent on inflation remaining in-check (the Fed’s two primary goals are full employment and stable prices).
Corporate Earnings
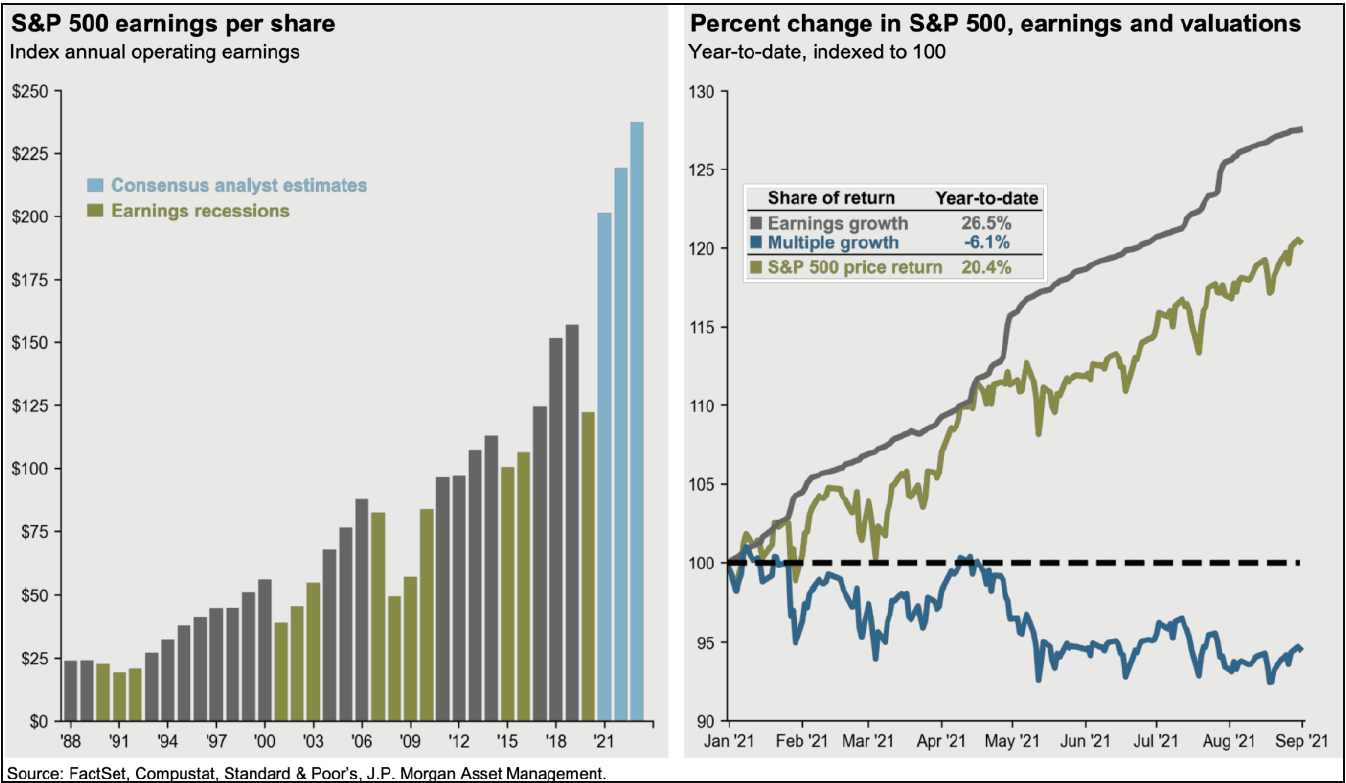
Second quarter earnings for the S&P 500 index continued to surprise to the upside with 87% of companies reporting better-than-expected sales and profits. The consensus estimate of 2021 S&P 500 earnings by professional analysts is now more than $200, and that number has been steadily increasing for the last several quarters which has allowed the index to move higher as well. However, as corporate earnings have continued to beat expectations, the rate of growth in earnings has outpaced the price appreciation of the S&P 500, which has actually made the index modestly less expensive when measured with a price-to-expected earnings perspective.
Valuation
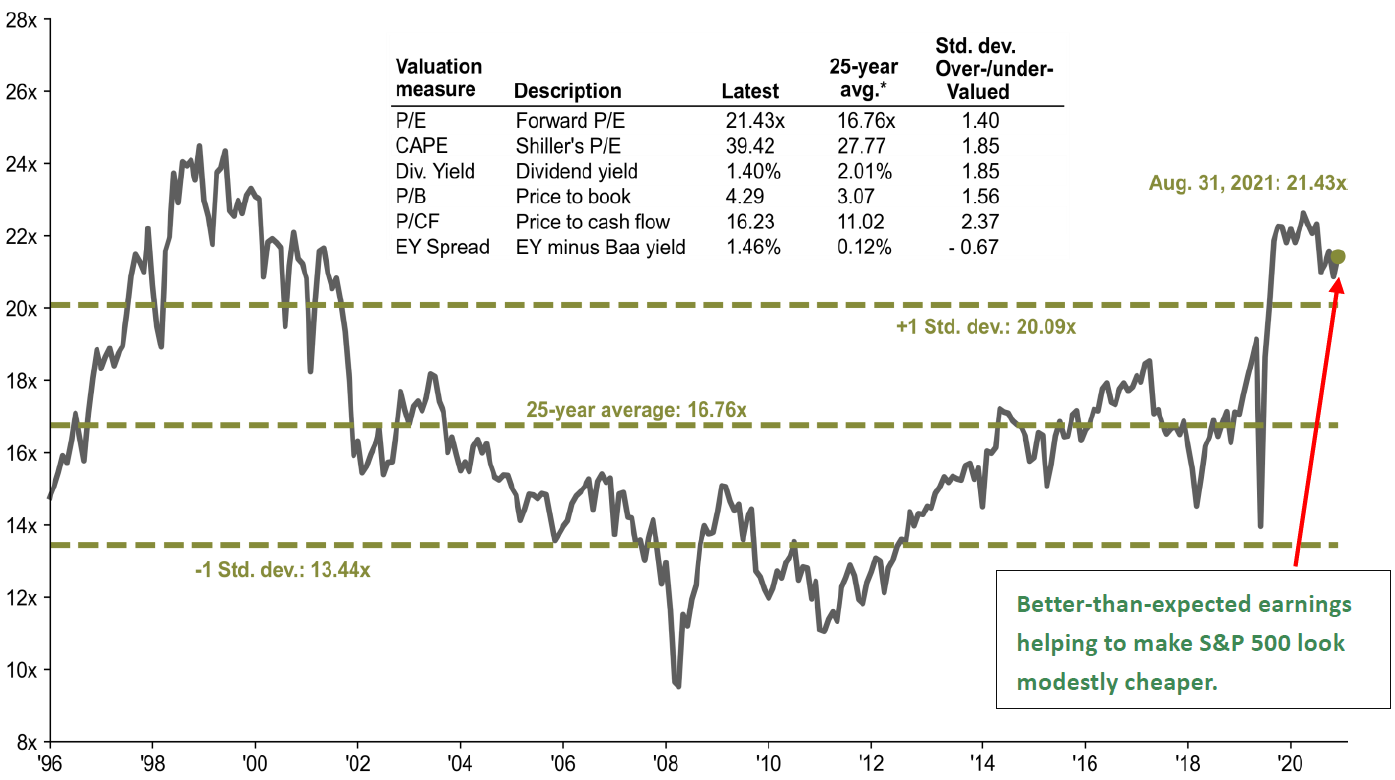
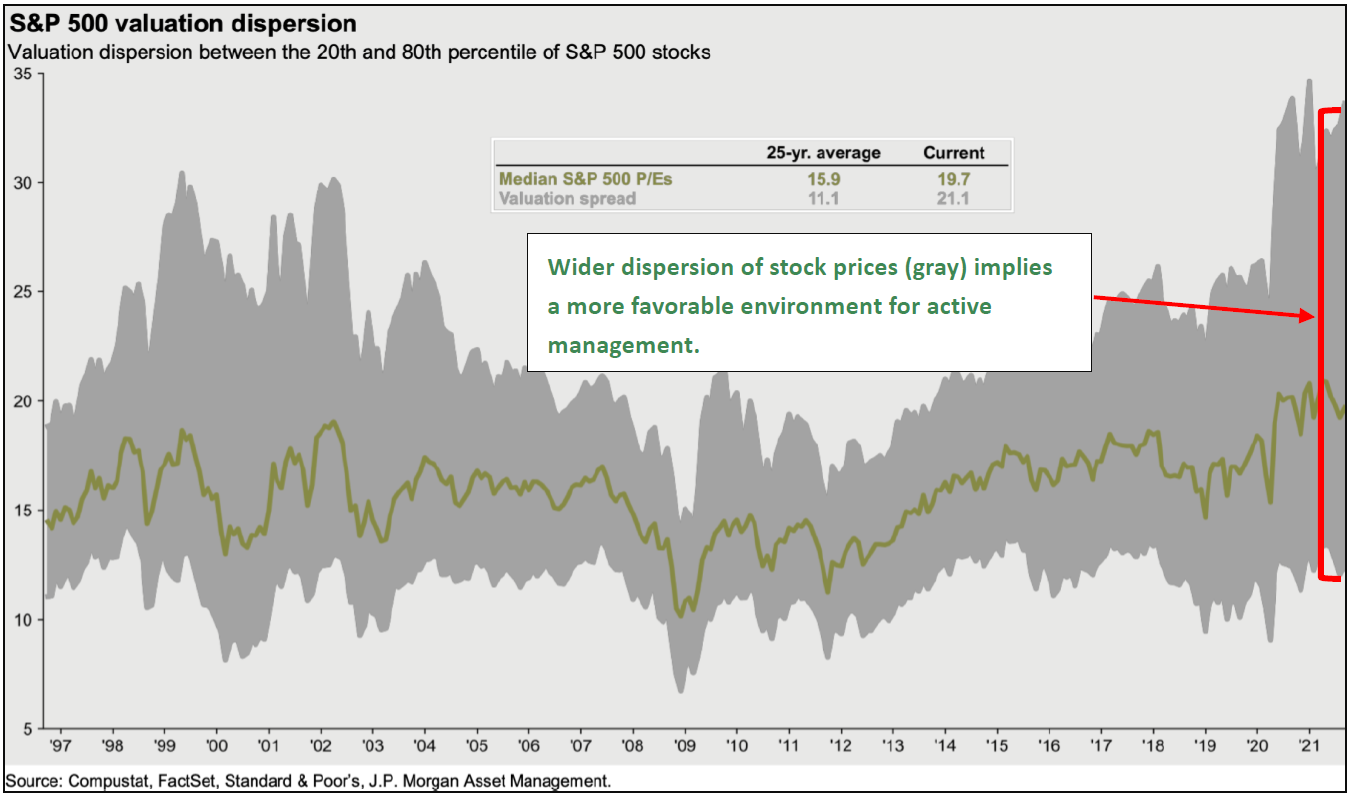
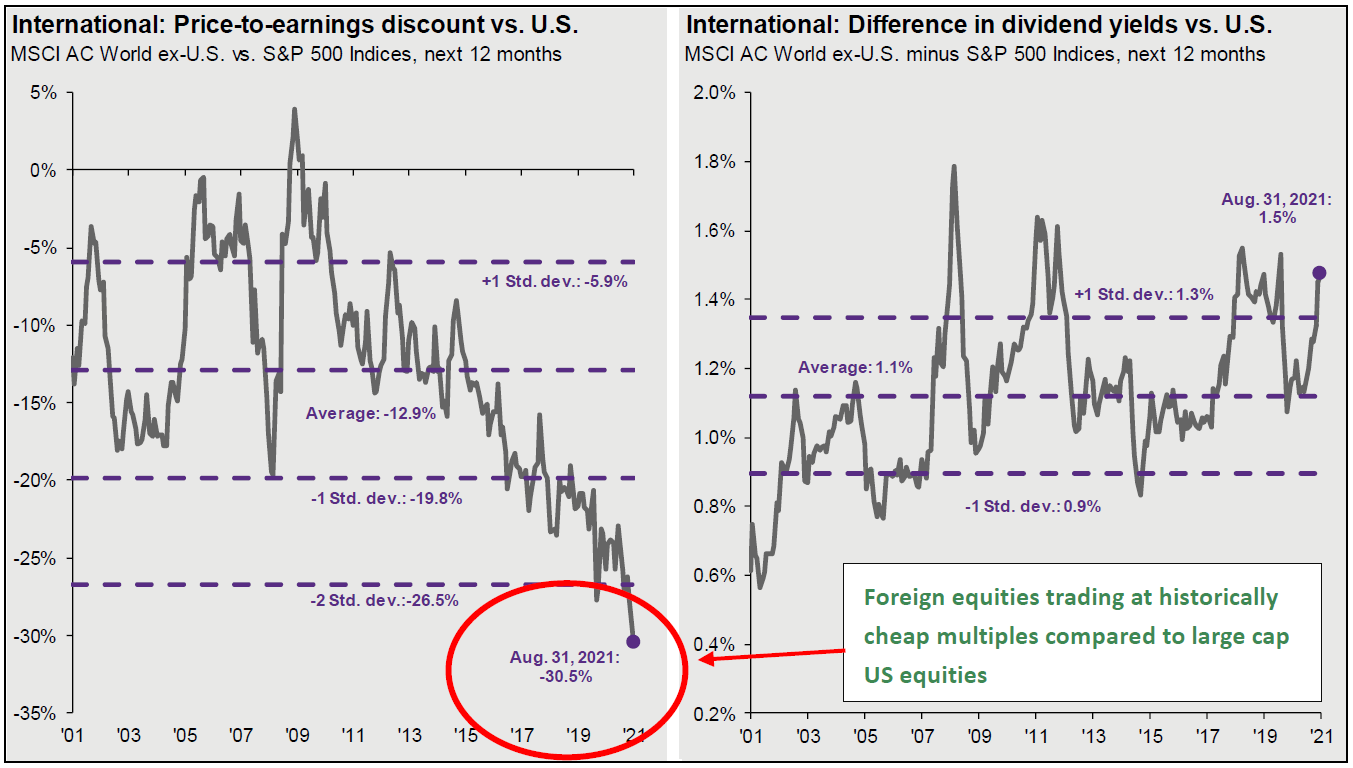
As mentioned above, as corporate earnings have beaten expectations, the price-to-expected earnings multiple of the S&P 500 index has trended back down toward a more normal range for the last few months (first chart). The second chart below highlights the very wide dispersion in stock prices within the S&P 500 index, implying a potentially more favorable environment for stock-pickers. Lastly, the third chart below exhibits the near-record price difference between the S&P 500 and foreign equities, which now trade at more than a 30% discount to large cap US stocks. It’s important to note that foreign companies are subject to different political environments, economic growth rates and demographic trends, and the indices that track foreign markets have different compositions than the S&P 500, so investors should fully evaluate these nuances and potential risks before making an allocation decision (rather than simply relying on simple inputs like relative valuation).
Asset Class Returns
| Category | Representative Index | August 2021 | YTD 2021 | Full Year 2020 |
|---|---|---|---|---|
| Global Equity | MSCI All-Country | 2.5% | 15.9% | 16.3% |
| US Large Cap Equity | S&P 500 | 3.0% | 21.6% | 18.4% |
| US Small Cap Equity | Russell 2000 | 2.2% | 15.8% | 20.0% |
| Foreign Developed Equity | MSCI EAFE | 1.8% | 11.6% | 7.8% |
| Emerging Market Equity | MSCI Emerging Markets | 2.6% | 2.8% | 18.3% |
| US High Yield Fixed Income | ICE BofAML High Yield | 0.6% | 4.6% | 6.2% |
| US Fixed Income | Barclays Aggregate Bond | -0.2% | -0.7% | 7.5% |
| Cash Equivalents | ICE BofAML 3 Mo Deposit | 0.0% | 0.0% | 0.5% |
| Source: Morningstar (total returns shown gross of fees) As of August 31, 2021 |
Prices & Interest Rates
| Representative Index | August 31, 2021 | Year-End 2020 |
|---|---|---|
| S&P 500 | 4,523 | 3,756 |
| Dow Jones Industrial Avg. | 35,361 | 30,606 |
| NASDAQ | 15,259 | 12,888 |
| Crude Oil (US WTI) | $68.50 | $48.42 |
| Gold | $1,815 | $1,902 |
| US Dollar | 92.63 | 89.94 |
| 2 Year Treasury | 0.20% | 0.13% |
| 10 Year Treasury | 1.30% | 0.93% |
| 30 Year Treasury | 1.92% | 1.65% |
| Source: Bloomberg, US Treasury (total returns shown gross of fees) As of August 31, 2021 |
Download PDF Version
Past performance may not be representative of future results. All investments are subject to loss. Forecasts regarding the market or economy are subject to a wide range of possible outcomes. The views presented in this market update may prove to be inaccurate for a variety of factors. These views are as of the date listed above and are subject to change based on changes in fundamental economic or market-related data. Please contact your Financial Advisor in order to complete an updated risk assessment to ensure that your investment allocation is appropriate.