

November 2, 2021 •OneAscent

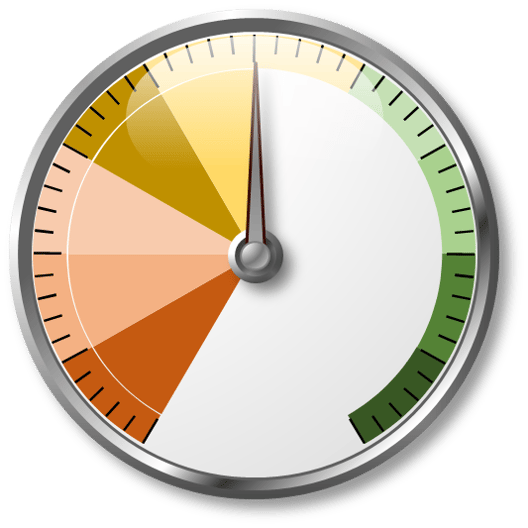
Overall Risk-Taking Score
 |
|
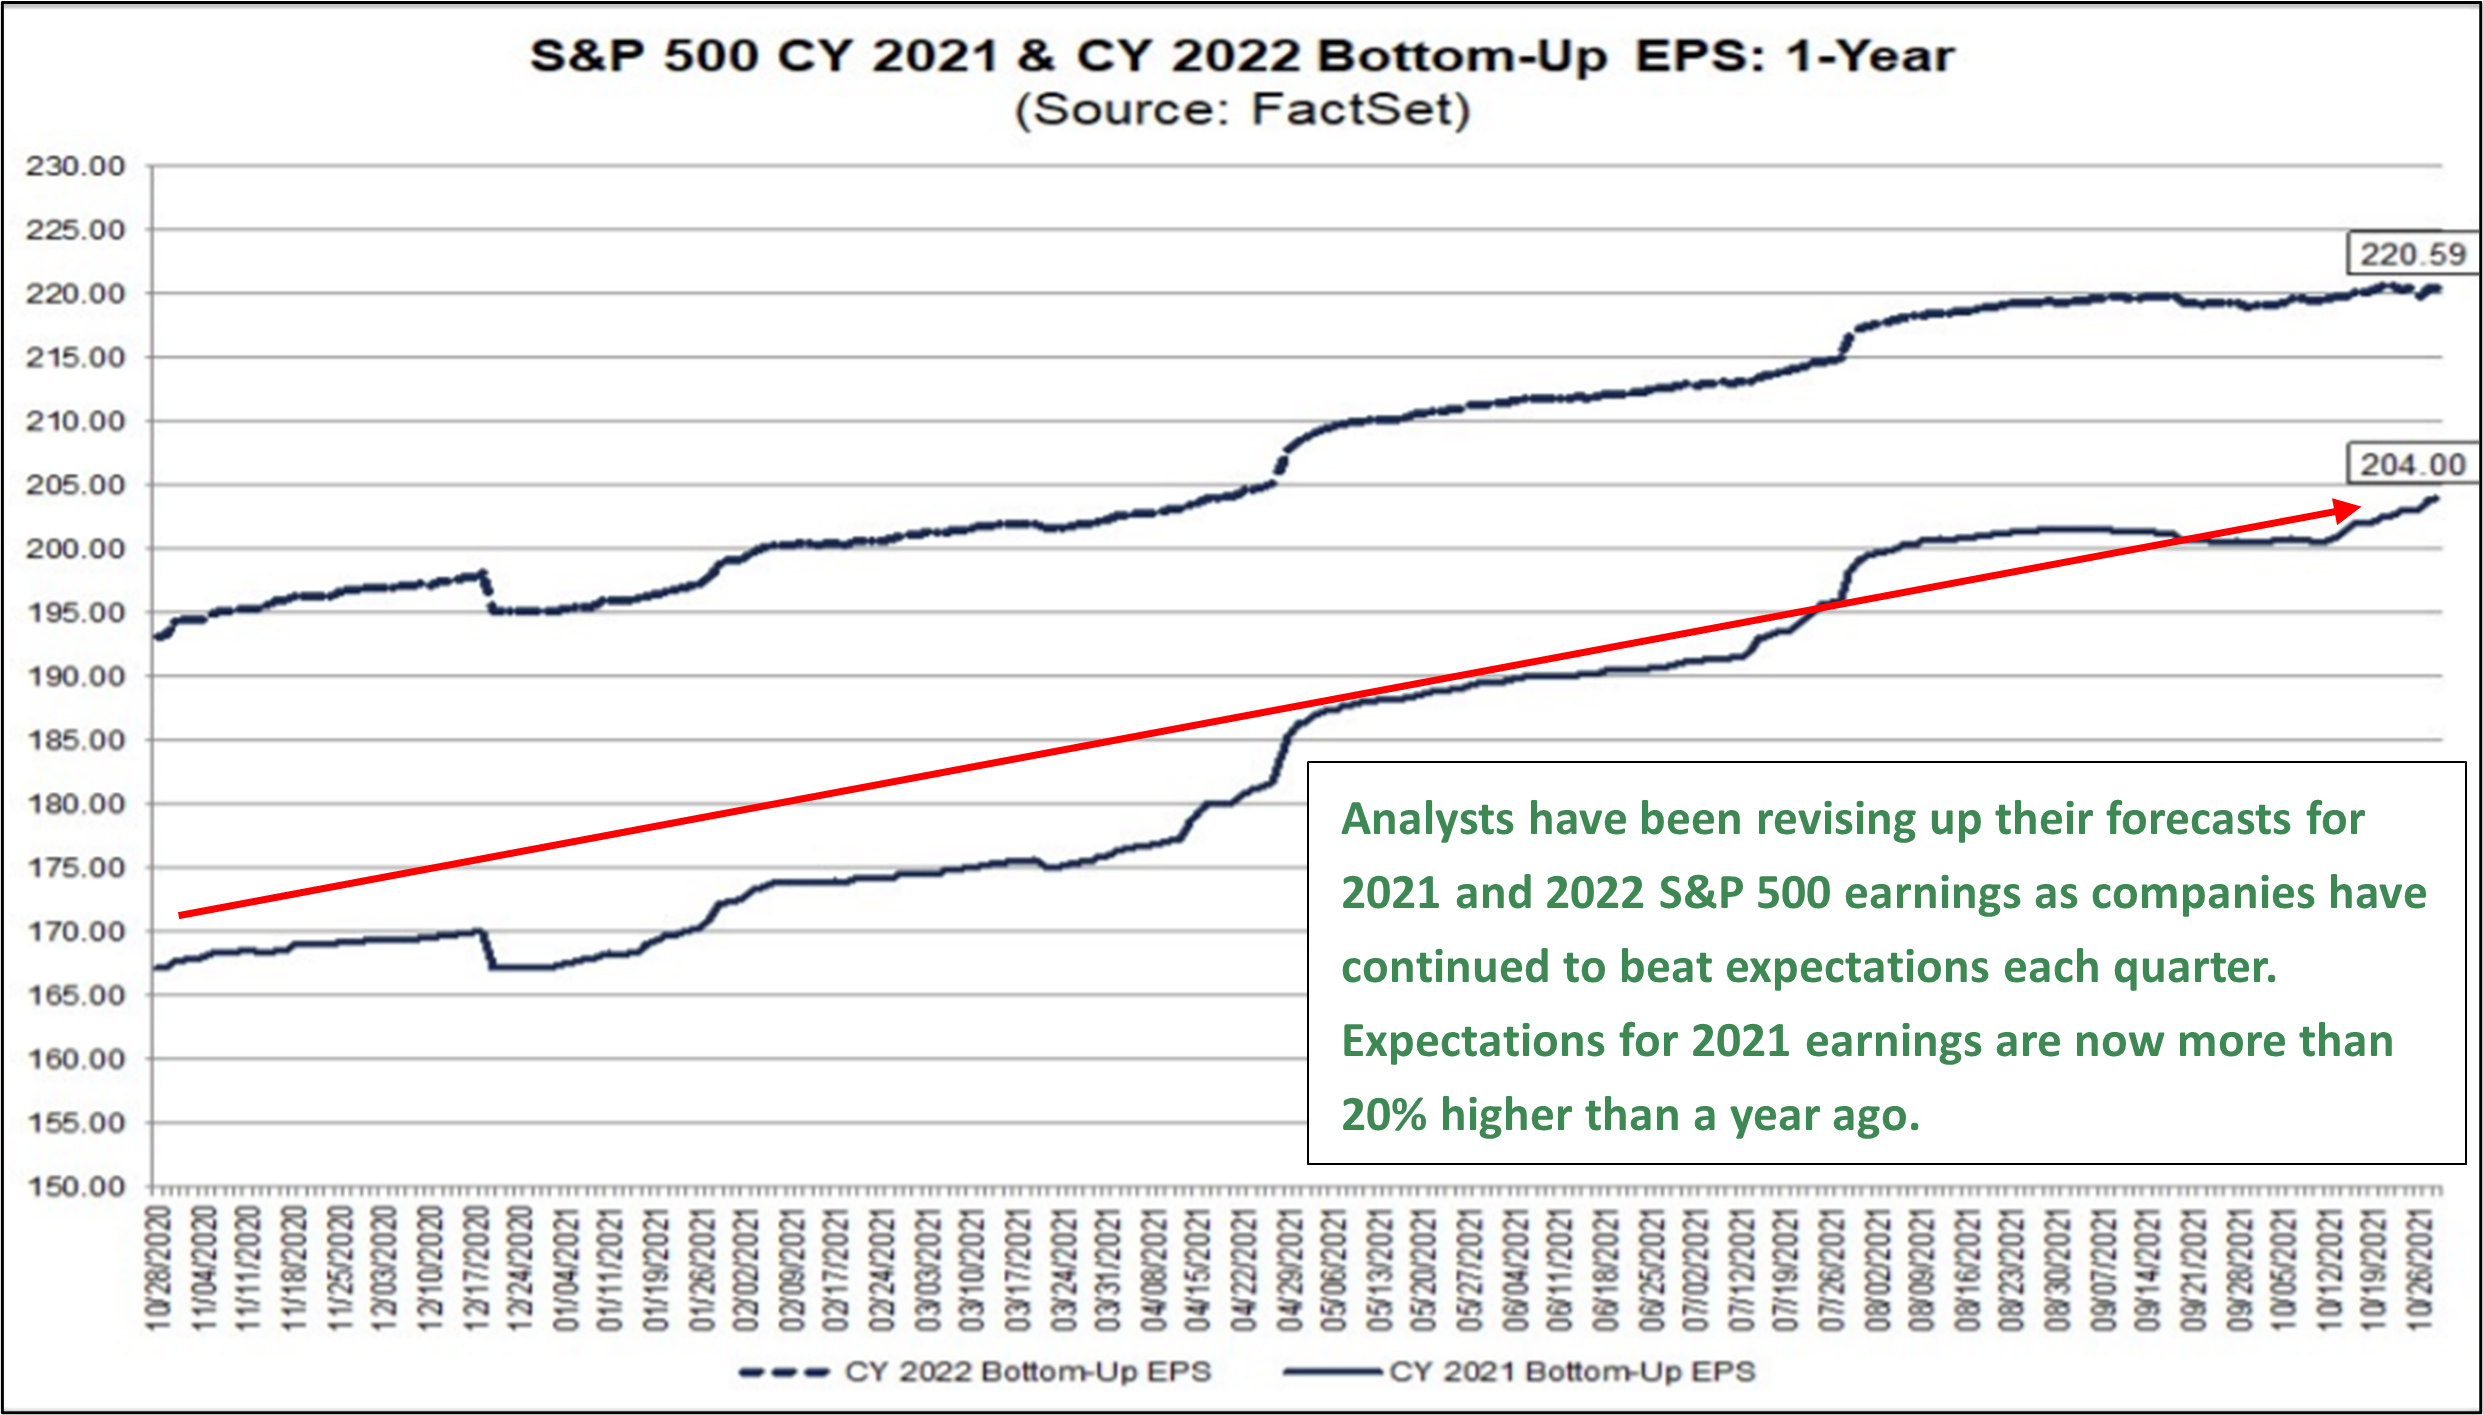
As of this writing, we are more than halfway through corporate earnings season with 56% of S&P 500 companies having reported third quarter results. We viewed this earnings season as particularly important given the potential for inflationary pressures and supply chain disruptions to drag on corporate profitability, particularly in an environment where market valuations are above their long-term averages. As of Friday, 56% of S&P 500 companies had reported Q3 results, with 82% outperforming analysts’ consensus expectations for earnings[1]. While a handful of companies like Apple and Amazon cited challenges related to getting products to consumers, the key takeaway is that demand remains strong; so strong that suppliers cannot keep up.
Of course, this is an oversimplification of a complex system, but at this stage, we do not anticipate that higher costs or challenges getting goods to households will pose a long-term threat to growth. The pandemic may have accelerated an existing trend of baby-boomer retirements, which has led to upward pressure on wages and a significant demand for labor. As a result, households, on average, are seeing wage gains, their financial position is improving, and they feel confident to spend. The labor market is improving, and financial conditions remain accommodative. Risk assets, at the broad index level, such as US equities and credit, are trading above long-term averages, which is the primary factor holding back the overall risk-taking score. However, we believe today to be an opportune time to hold actively managed strategies in portfolios as there exists significant valuation dispersion in the market not seen since the beginning of the century.
Source: JP Morgan
Economy
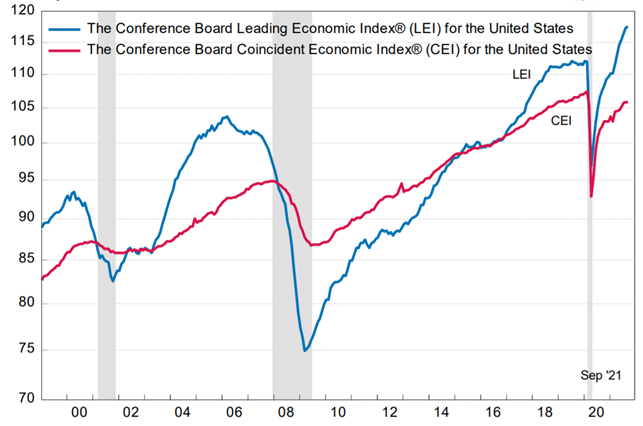
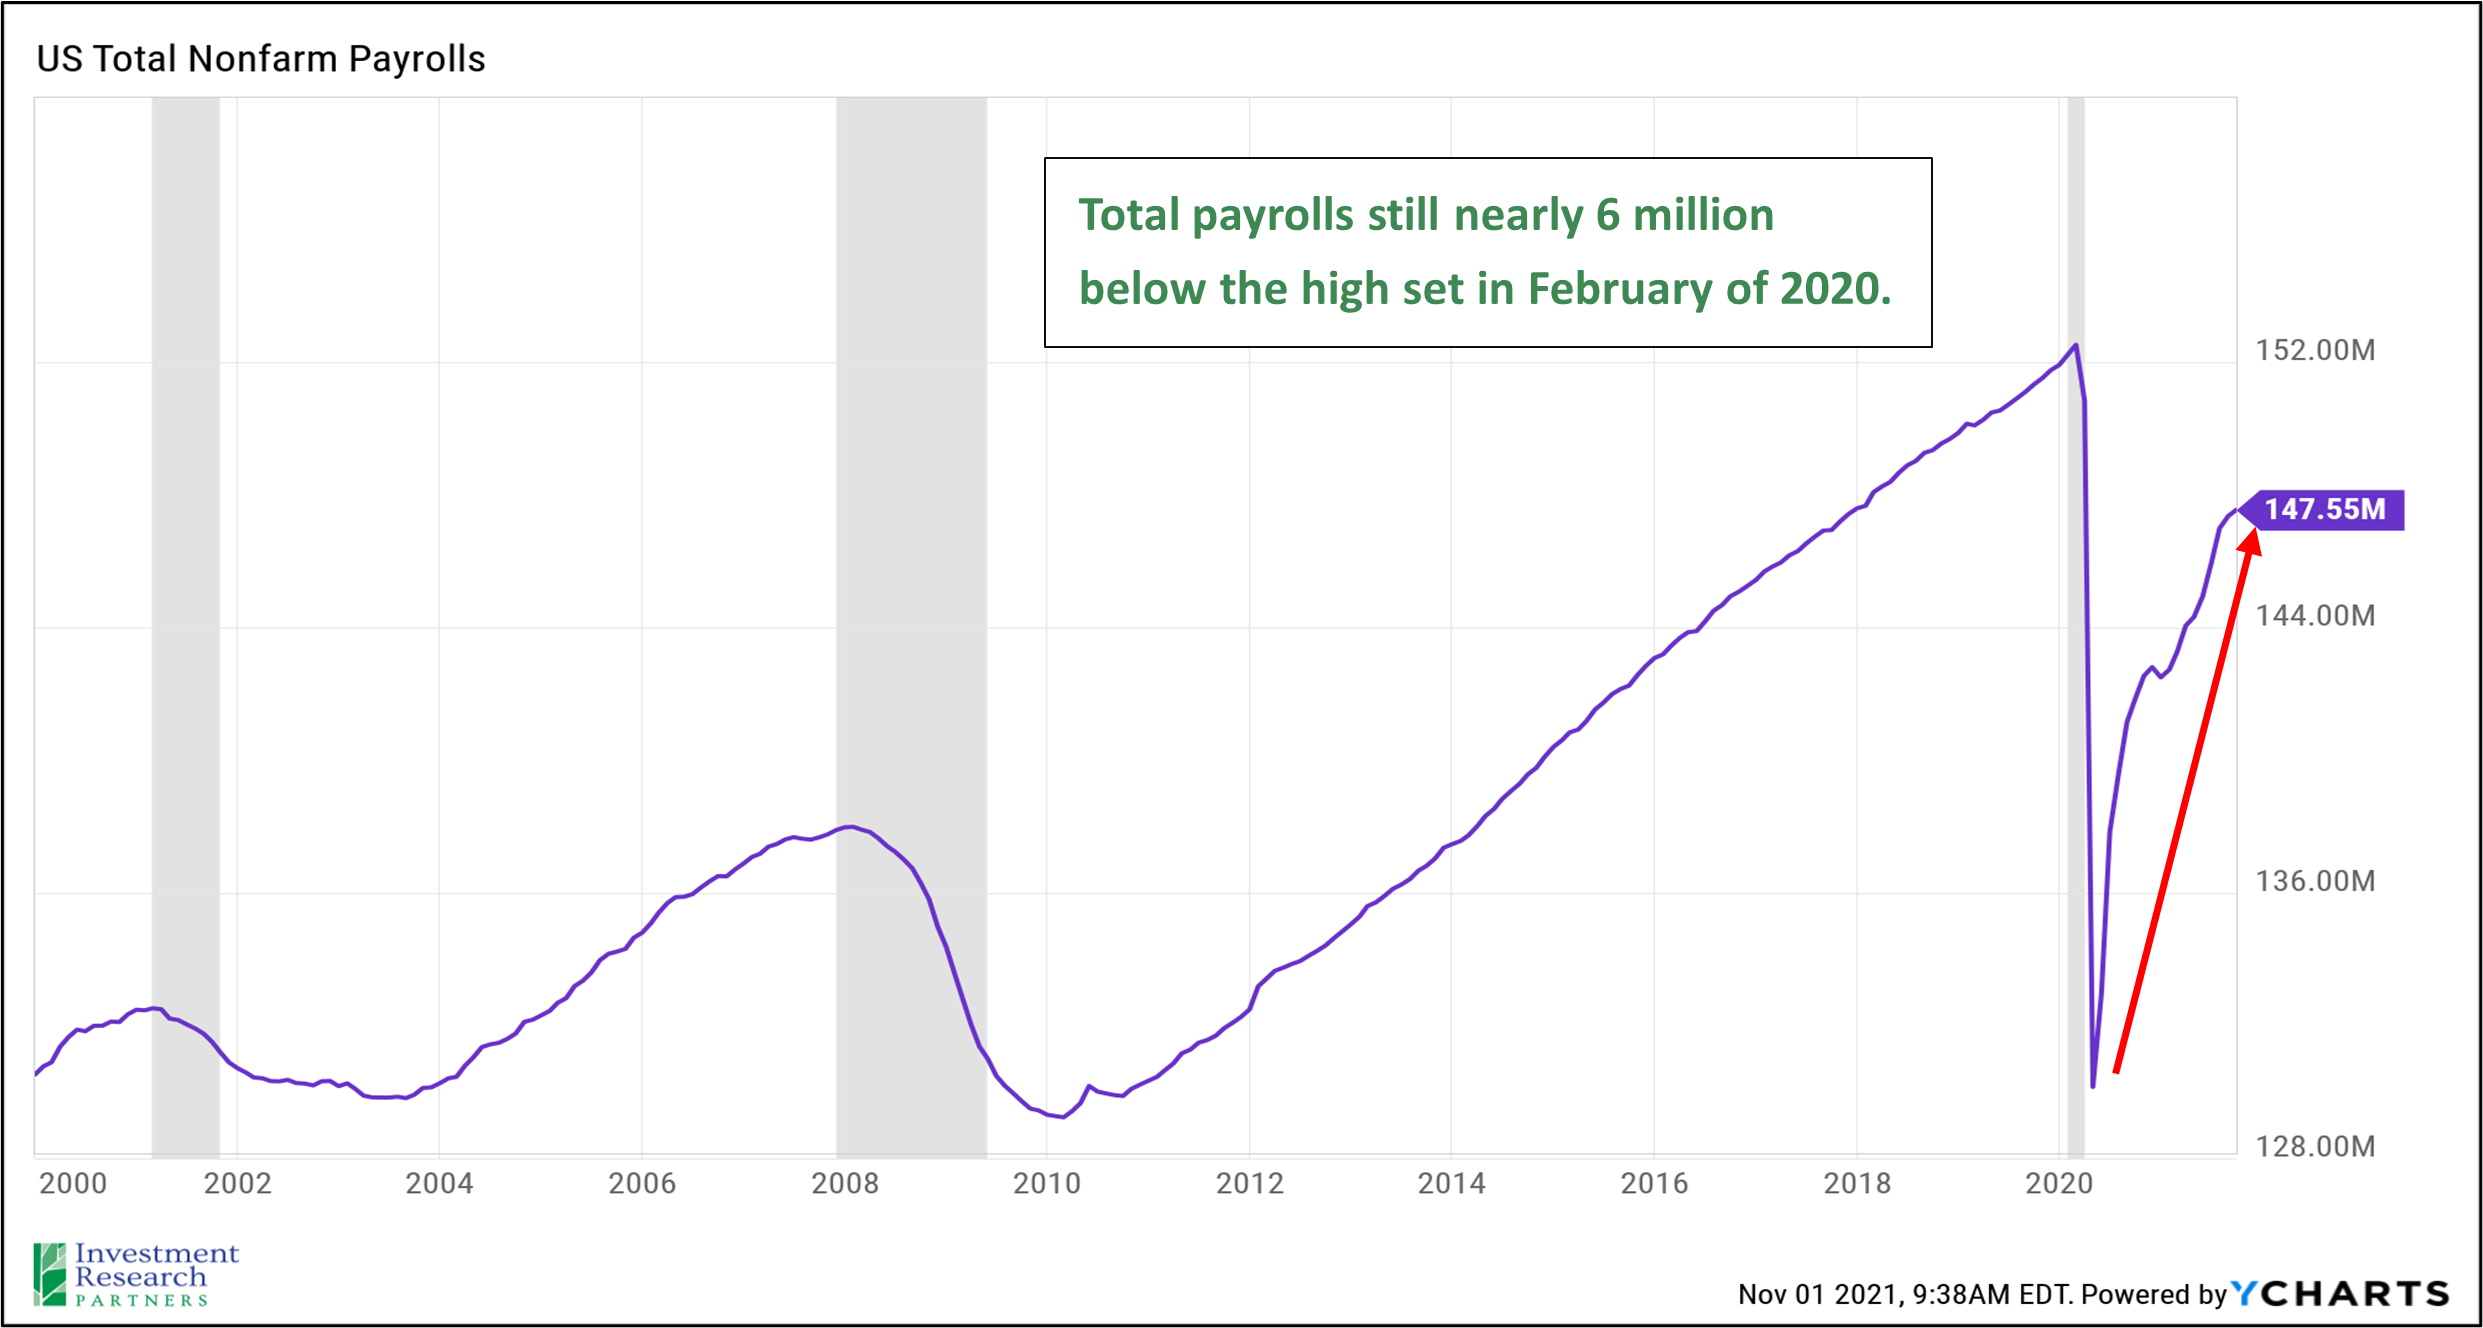
The US economy remains on a path for growth. The Conference Board Leading Economic Indicator Composite (pictured below in blue), which seeks to track data that has historically been predictive of future economic growth such as trends in the labor market, manufacturing, and financial conditions, remains in an upward trend. The labor market continues to improve, and job openings are plentiful. Total US nonfarm payrolls remain approximately 5 million below the all-time high set in February 2020 just before the pandemic. The US Federal Reserve has communicated that they will look for employment to recover to that level before beginning to raise interest rates, though if inflation significantly outpaces expectations, the central bank may be forced to raise interest rates sooner.
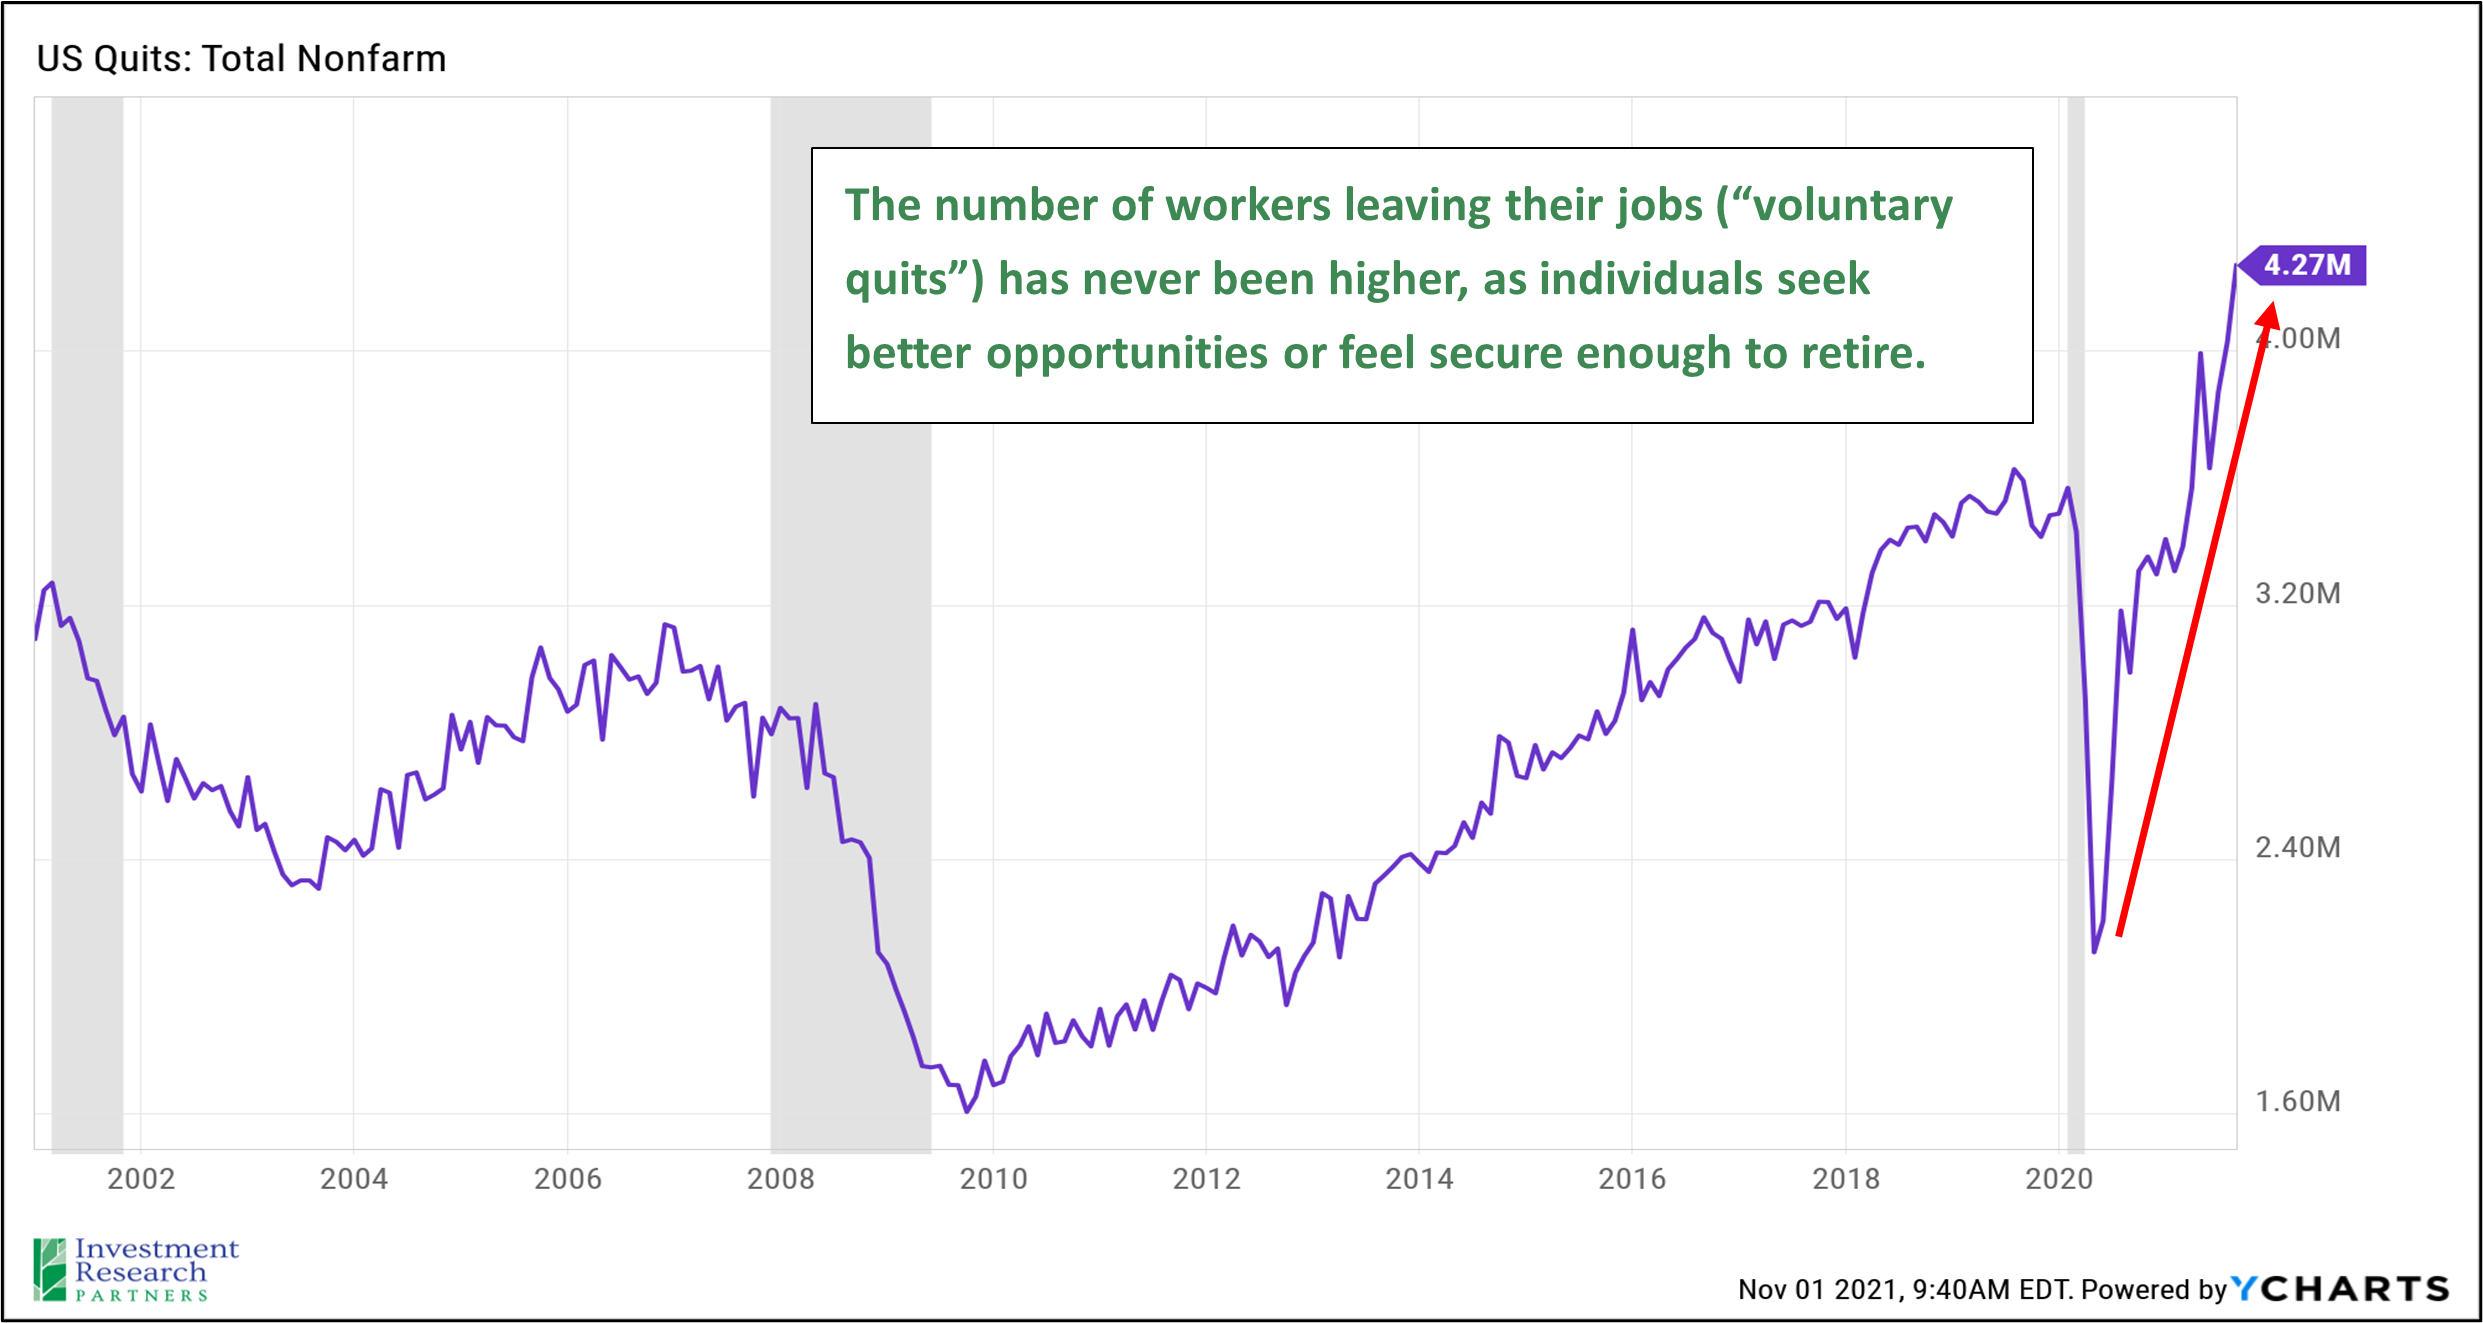
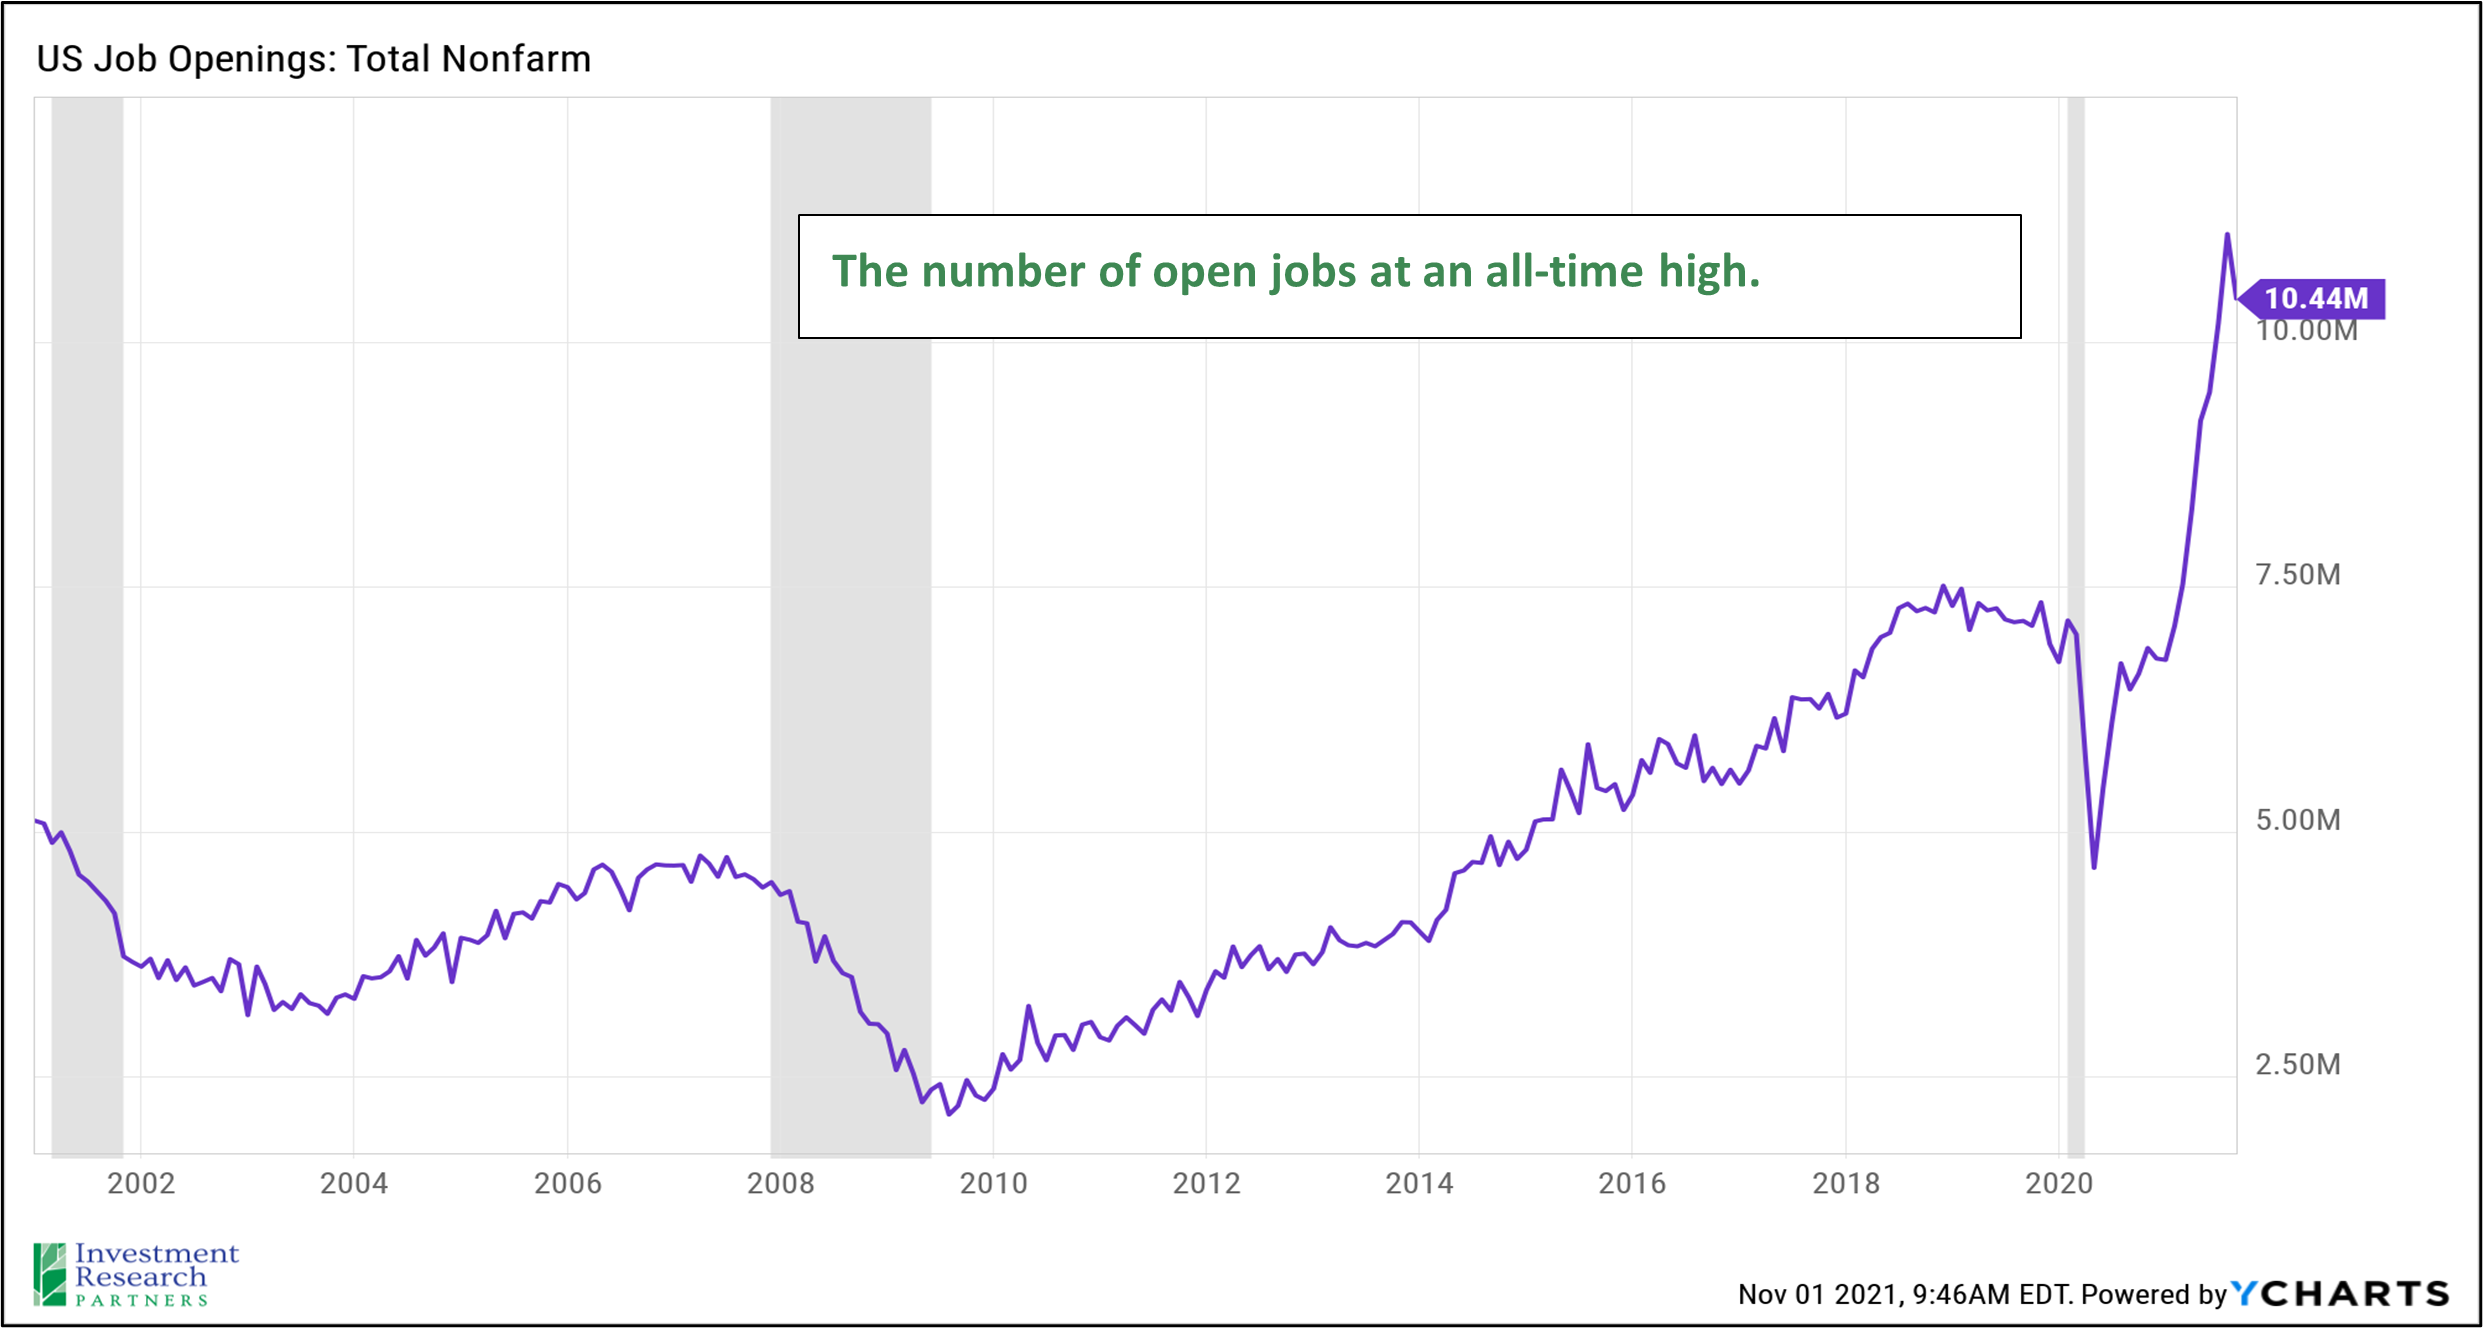
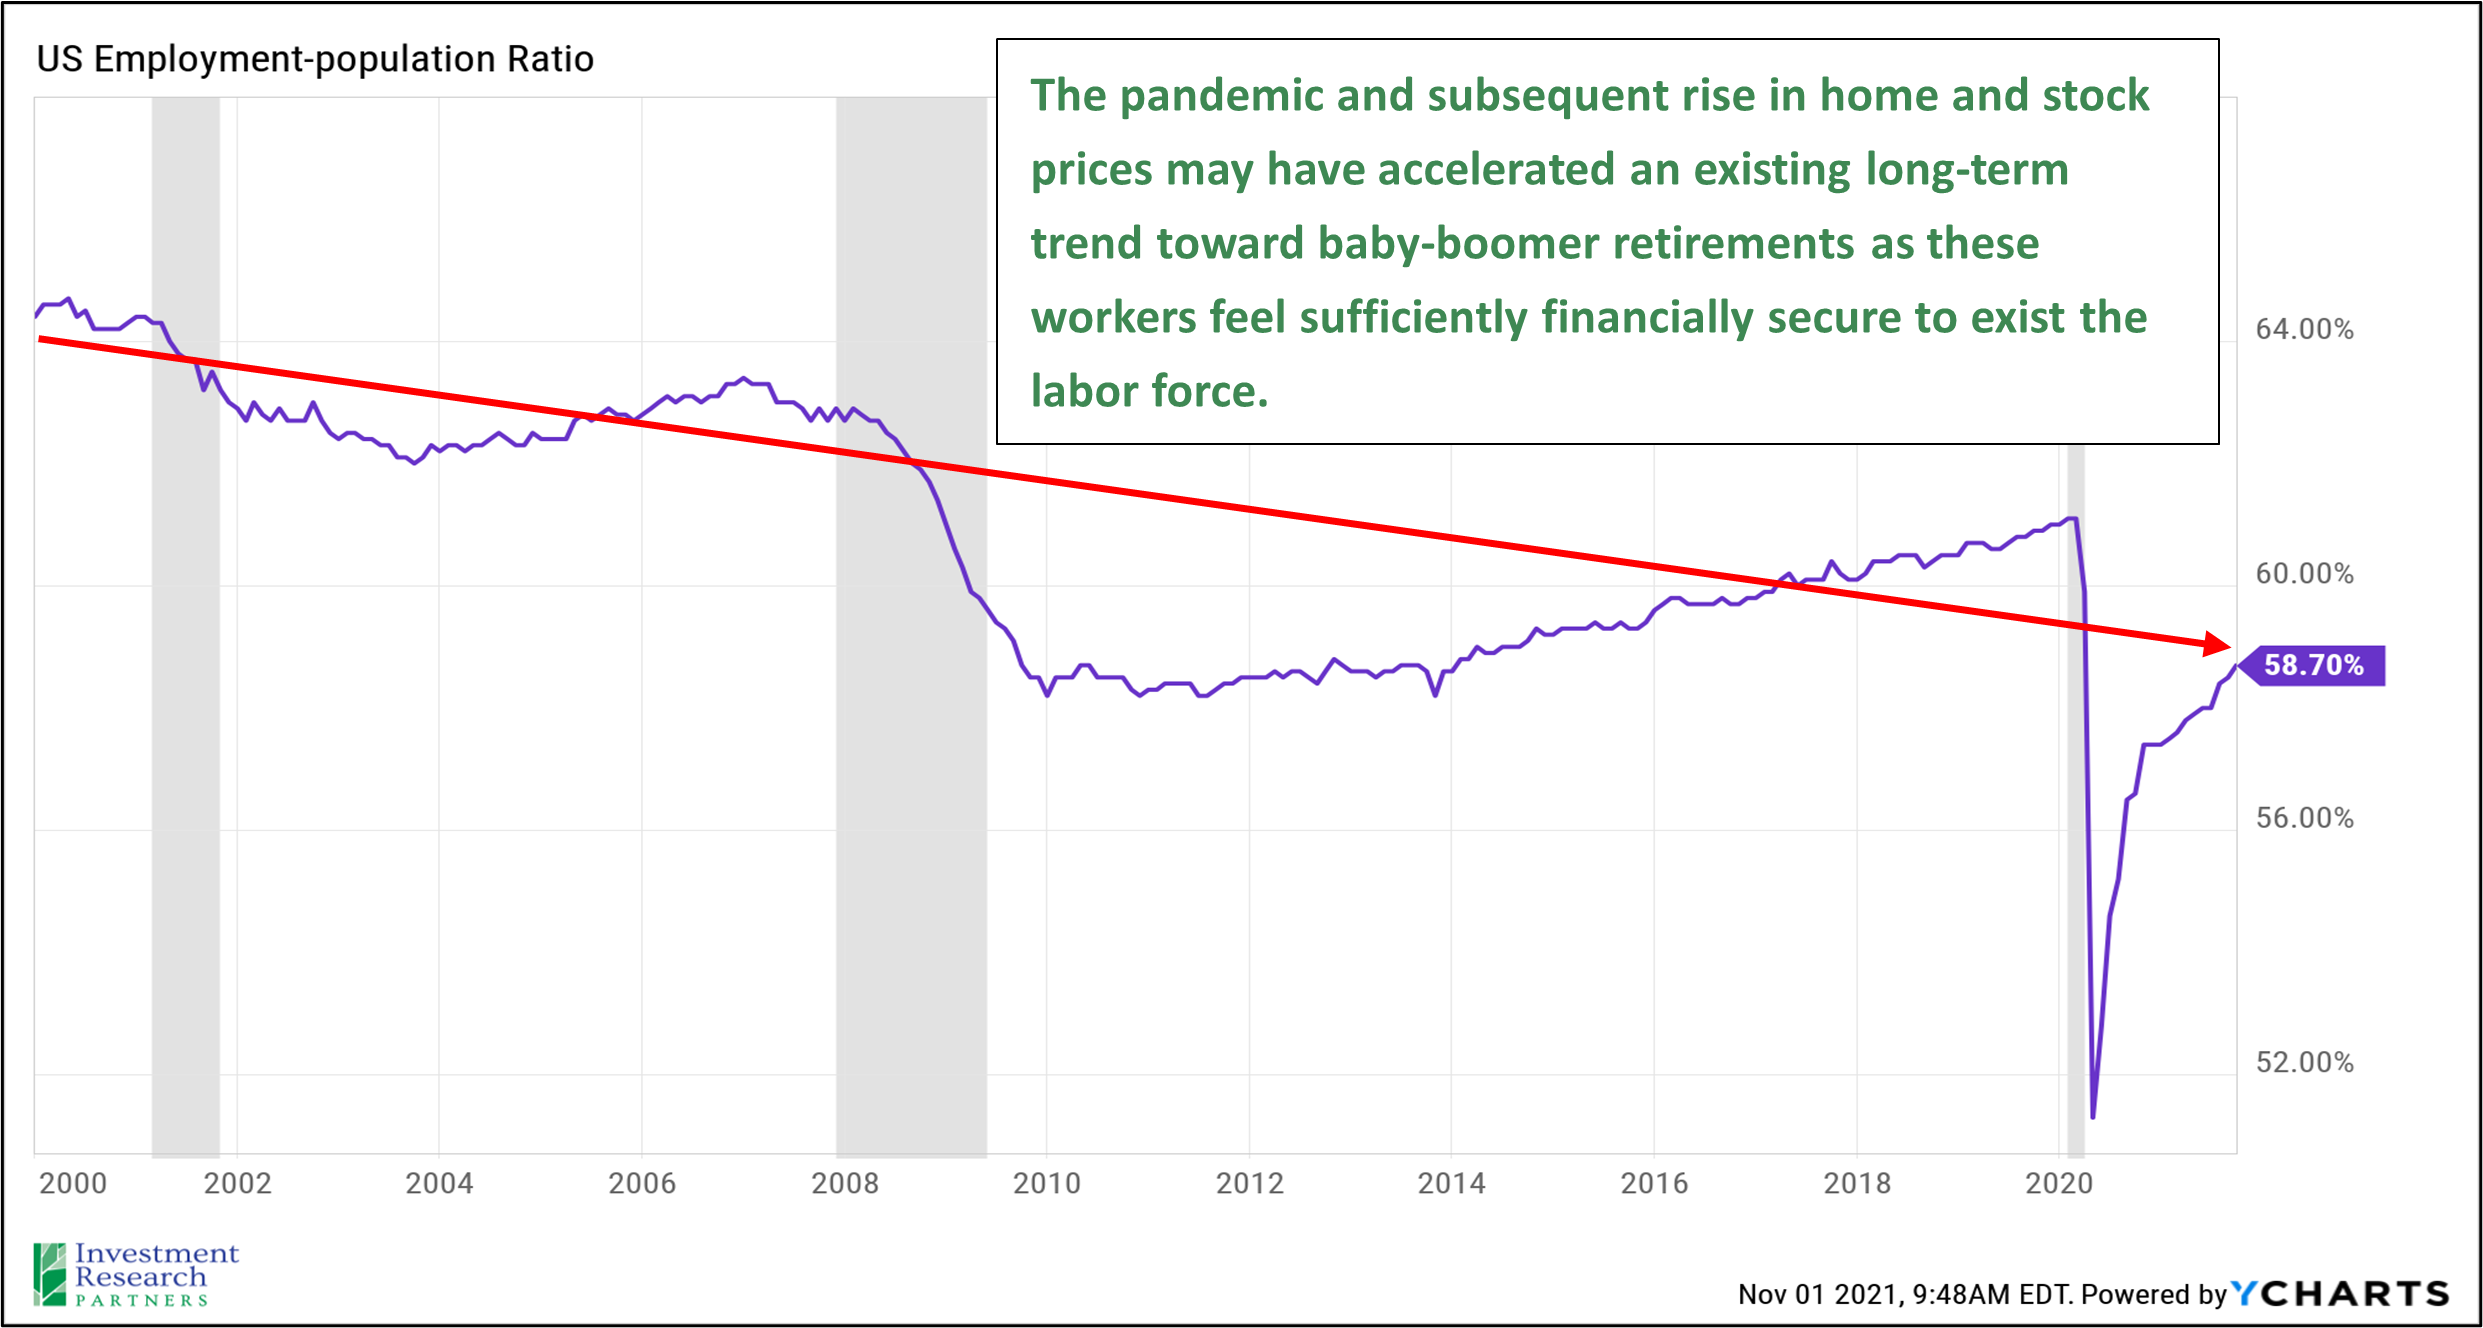
Given the robust pace of economic growth during the reopening of 2021, it would not be surprising to see the path toward closing the gap to full employment occur faster than during previous economic recoveries, particularly given the elevated number of job openings (see third chart below). It appears that those in our economy providing labor have an advantage today, so it would not be surprising to see continued wage gains over the next several quarters. The pandemic may have accelerated an existing trend of baby-boomer retirements, particularly as home and portfolio values have increased and households feel more financially secure. Encouraging those workers to rejoin the labor force may require premium wages.
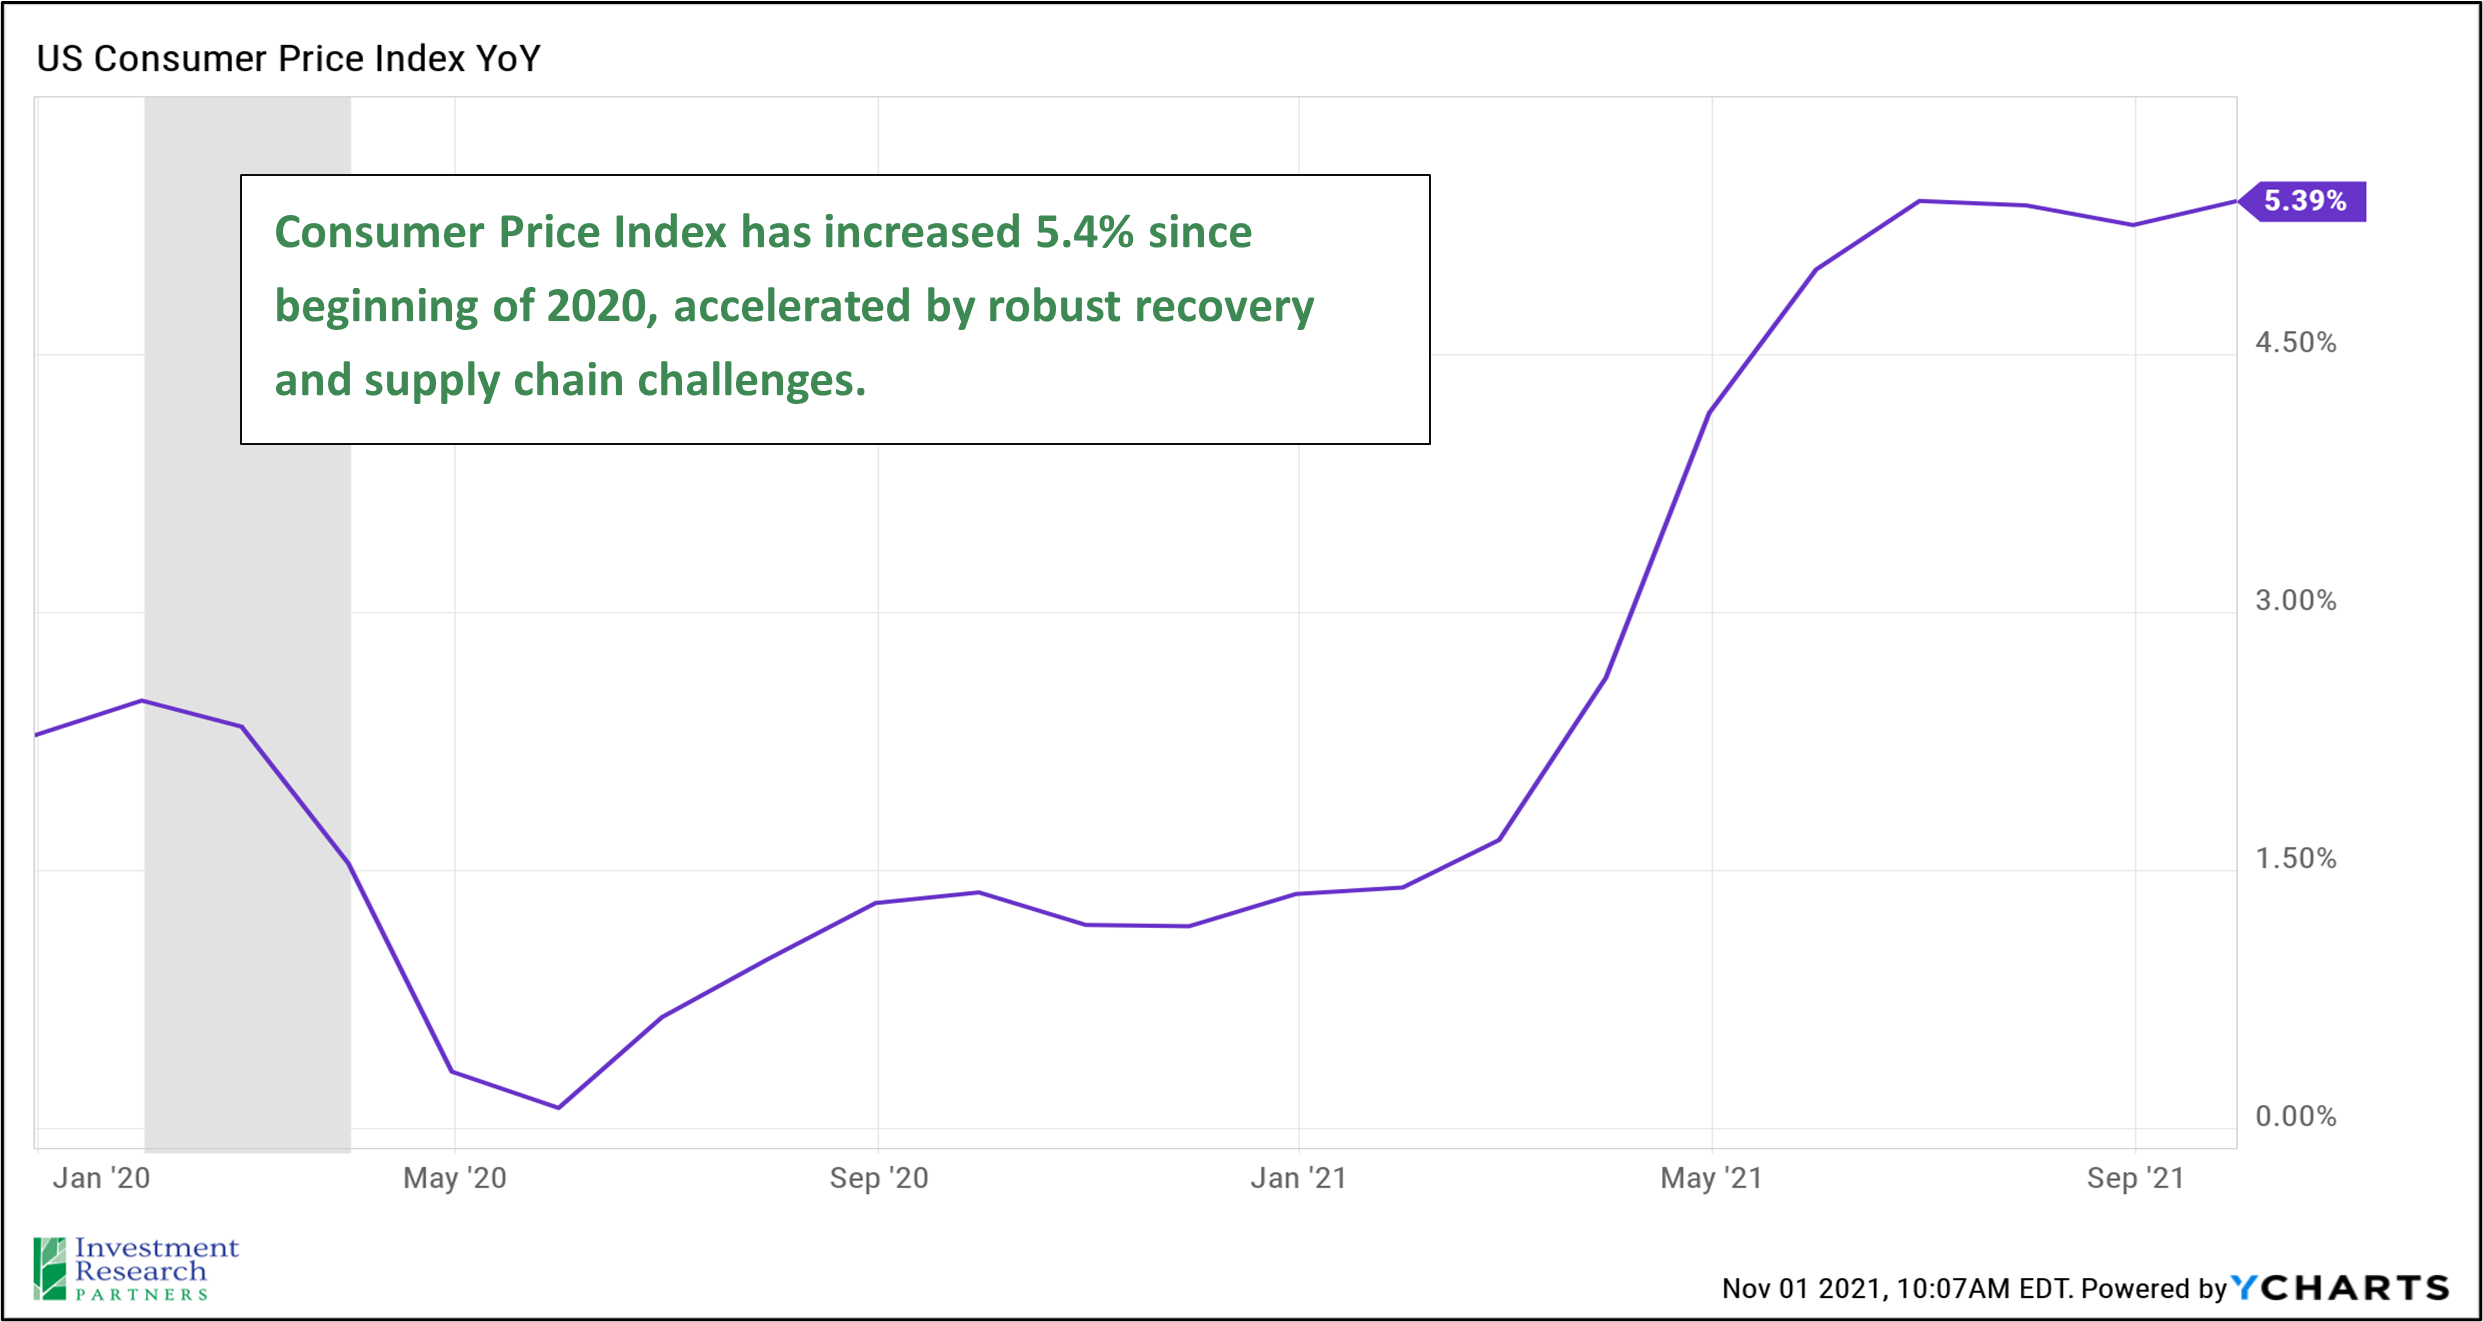
Inflation
Inflation has been all around us in the financial assets like home prices and stock prices for a decade, but the abrupt and robust economic recovery of 2021 has led to more traditional forms of inflation such as higher costs for labor, fuel, and food. The Consumer Price Index (CPI) is meant to track the cost of a basket of goods and services across the country. It is the government’s attempt at approximating and measuring the average rise in prices for an average basket of goods and services for an average household. Obviously, this method of averages is imperfect and likely won’t be the actual experience for a given American, but CPI represents a decent measure for understanding the general direction of prices.
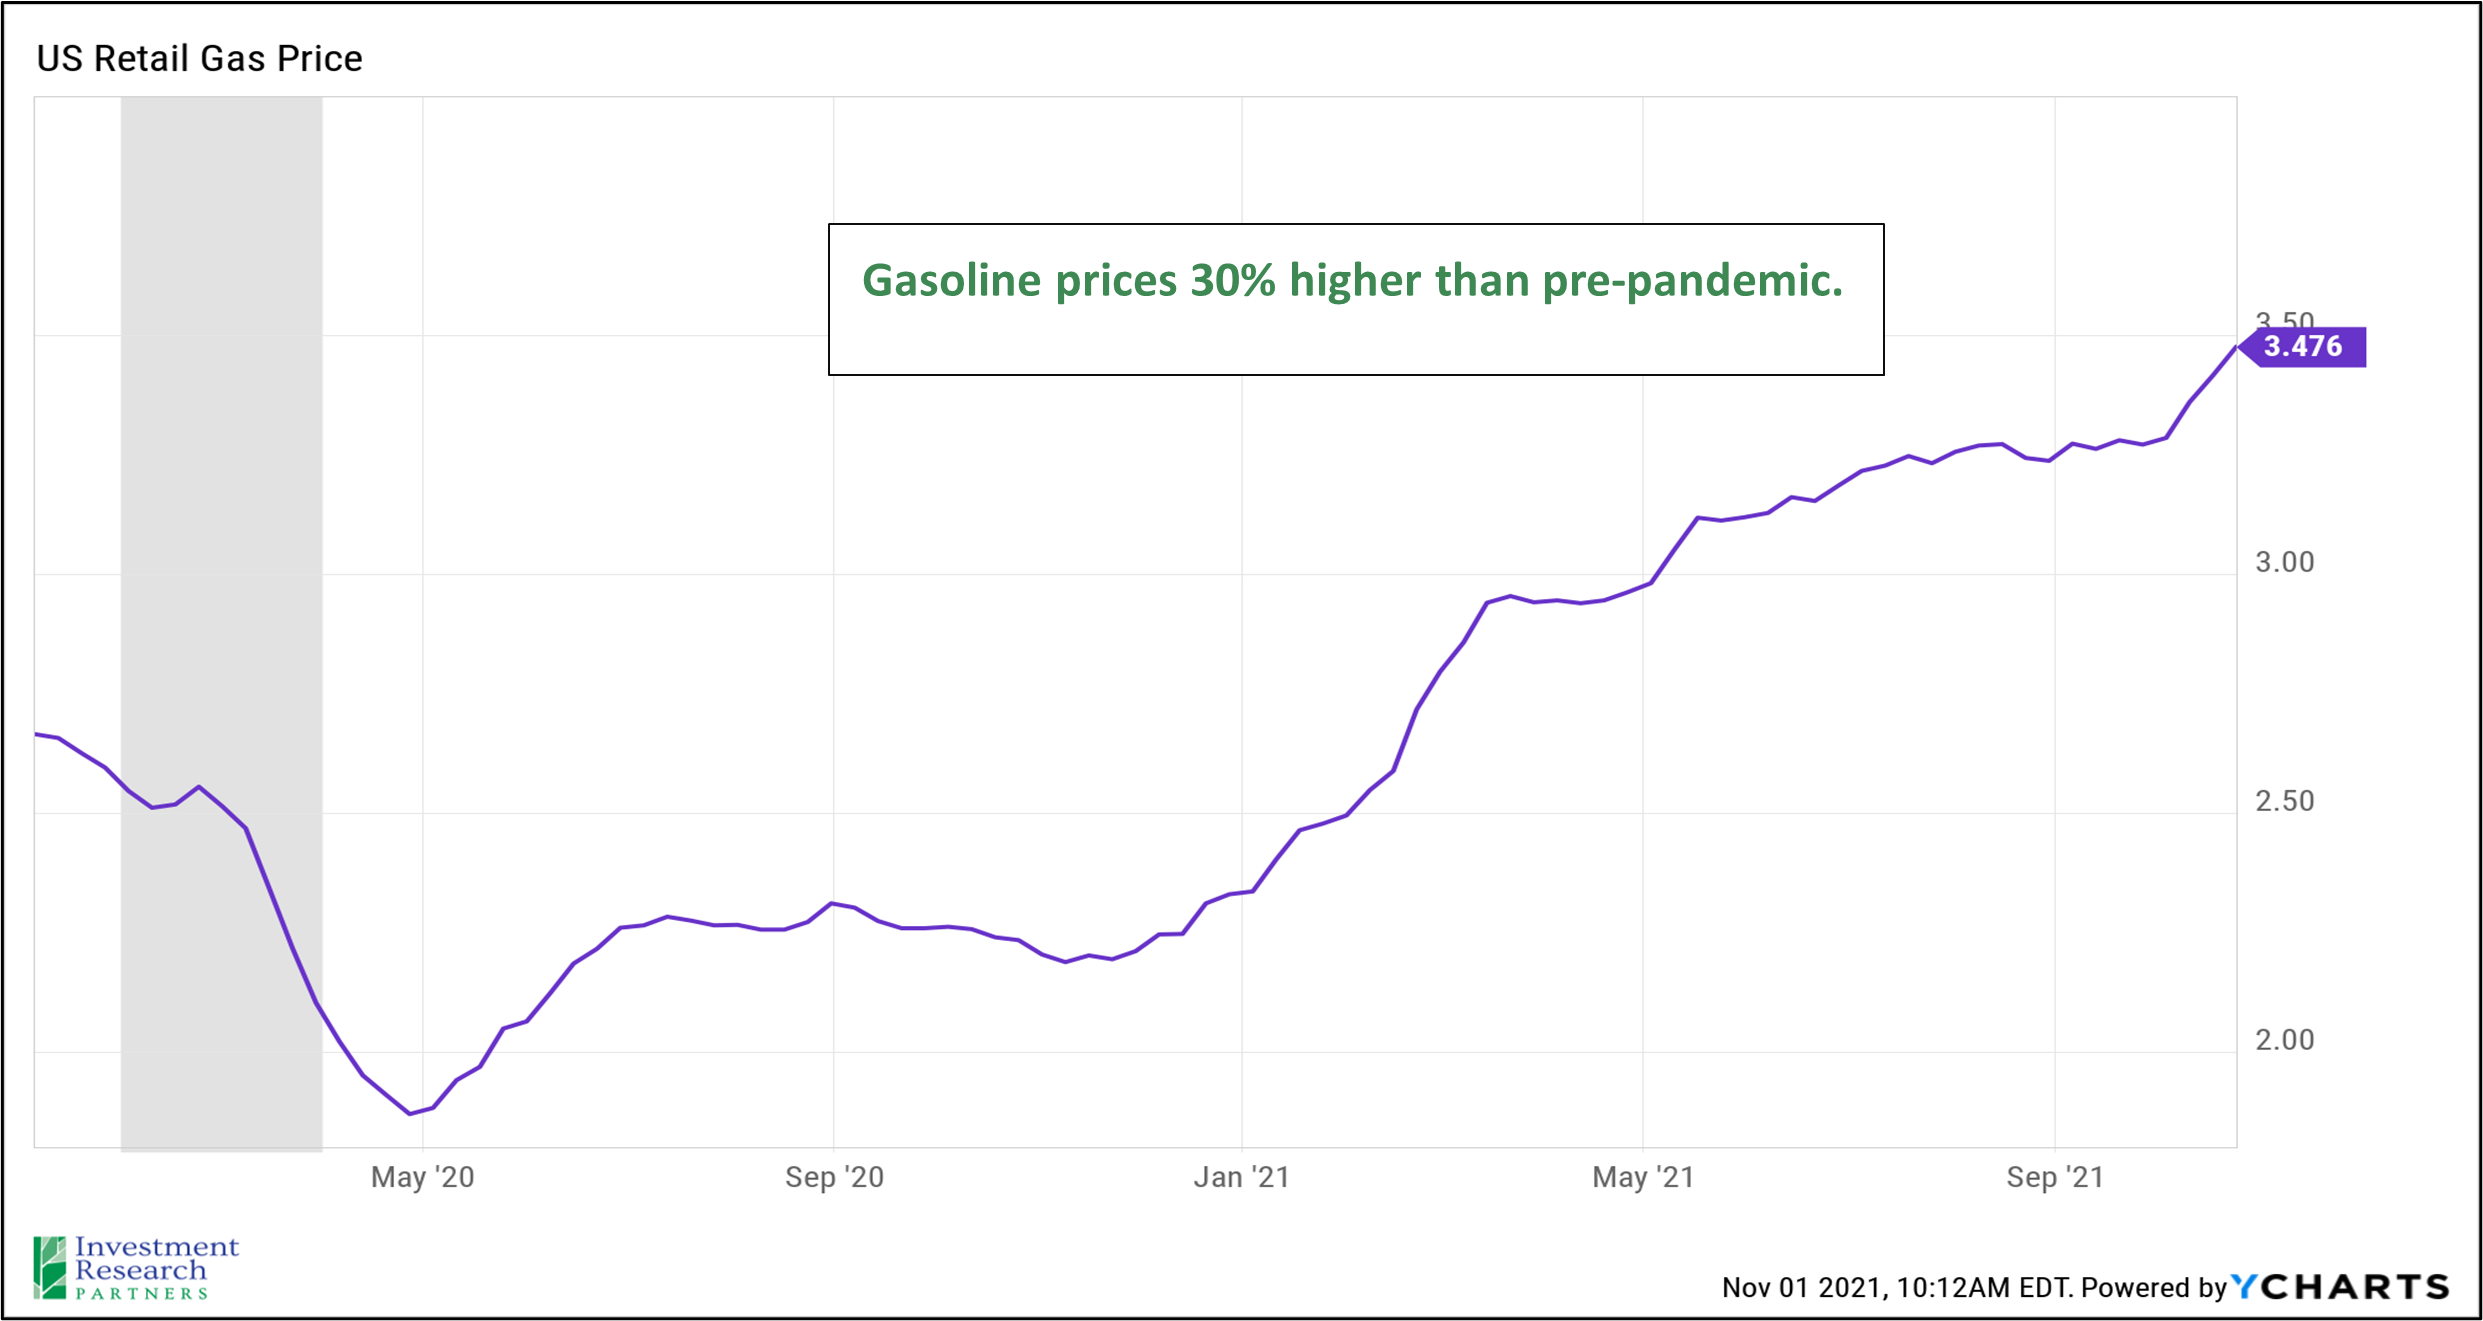
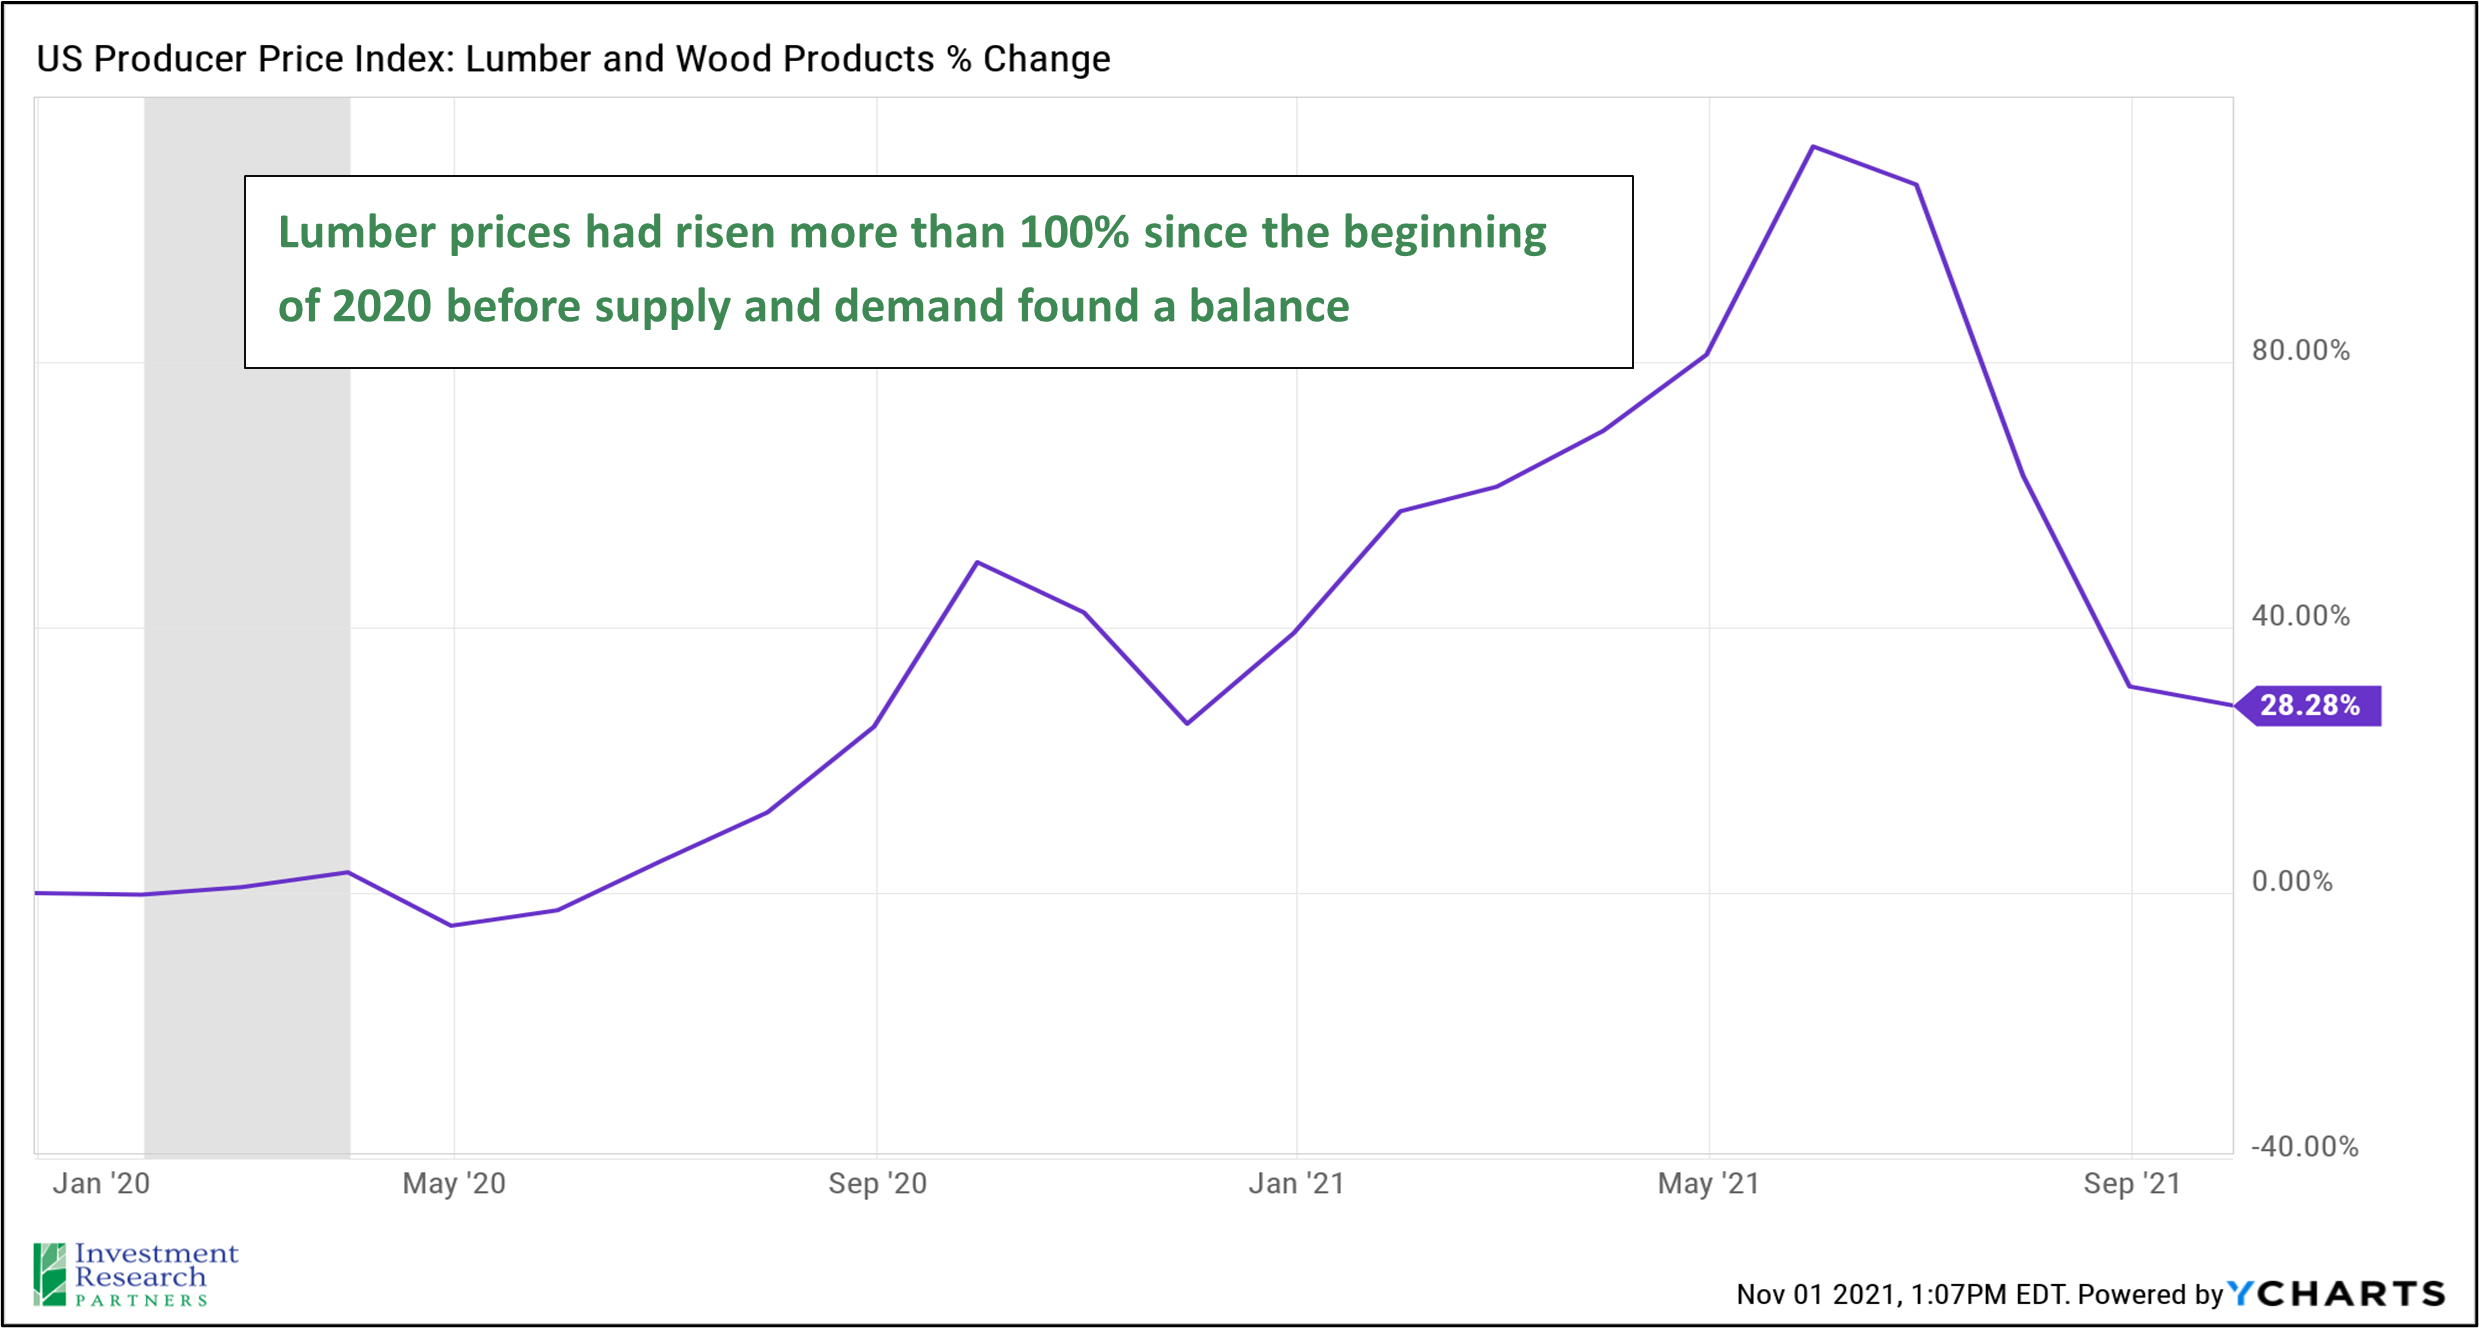
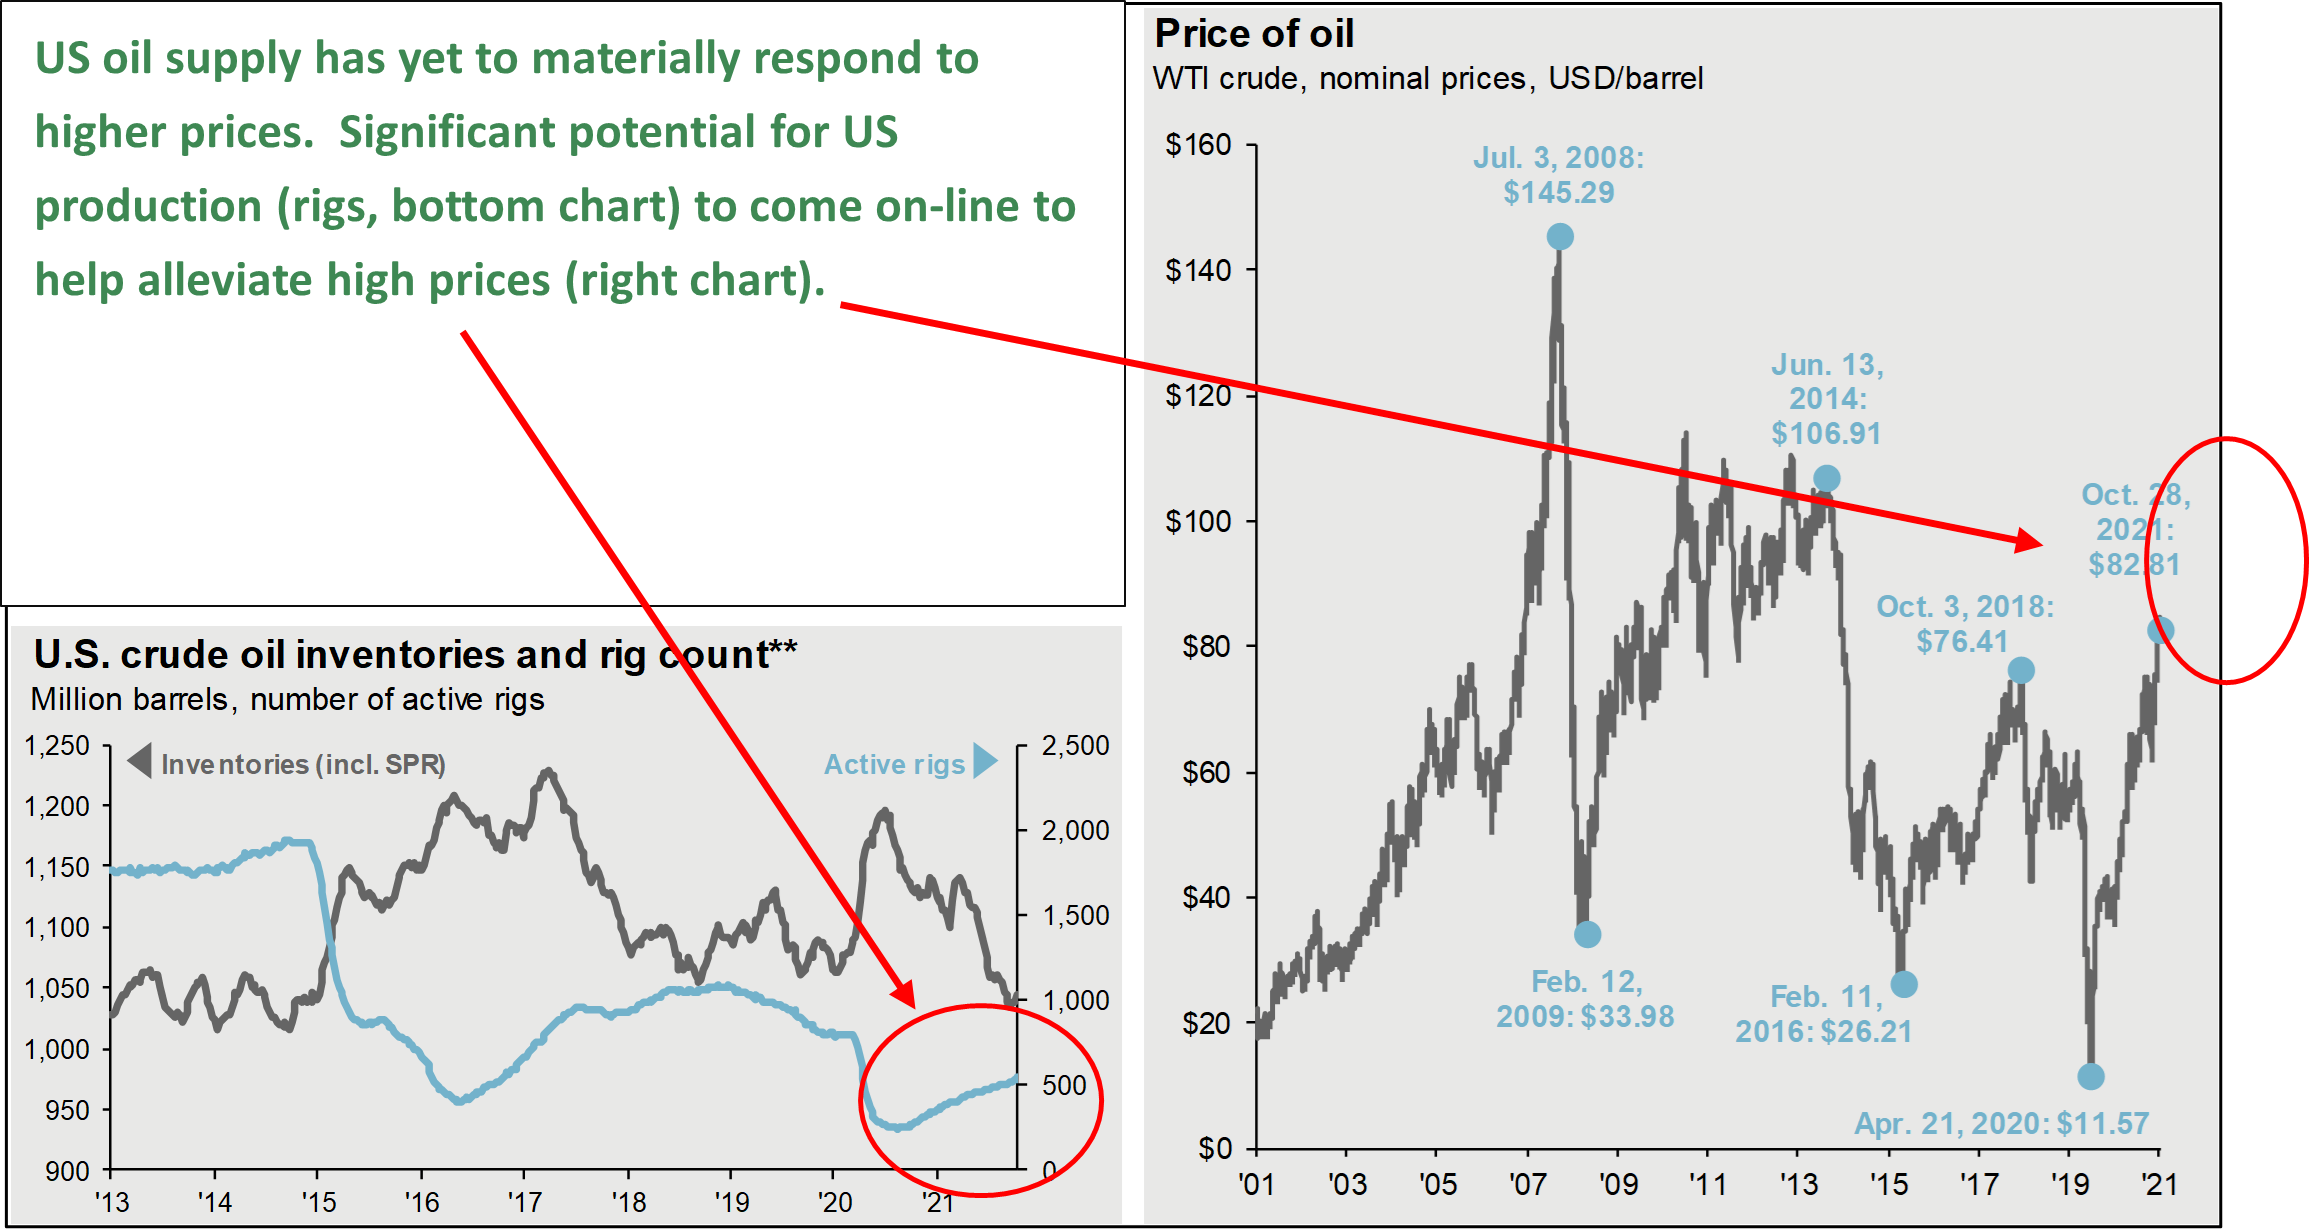
For example, home prices have risen 25% on average since the beginning of 2020. This is wonderful news for homeowners, and terrible for those seeking to purchase a home. Gasoline prices have risen more than 30% since the beginning of 2020, which poses a significant challenge to those who rely on combustion engines for transportation or as part of their business. However, like we witnessed with lumber prices earlier this year, supply and demand often have a tendency to balance themselves. Oil markets are no different, and we would not be surprised to see significant production capacity come online in the US and abroad to take advantage of higher prices and demand.
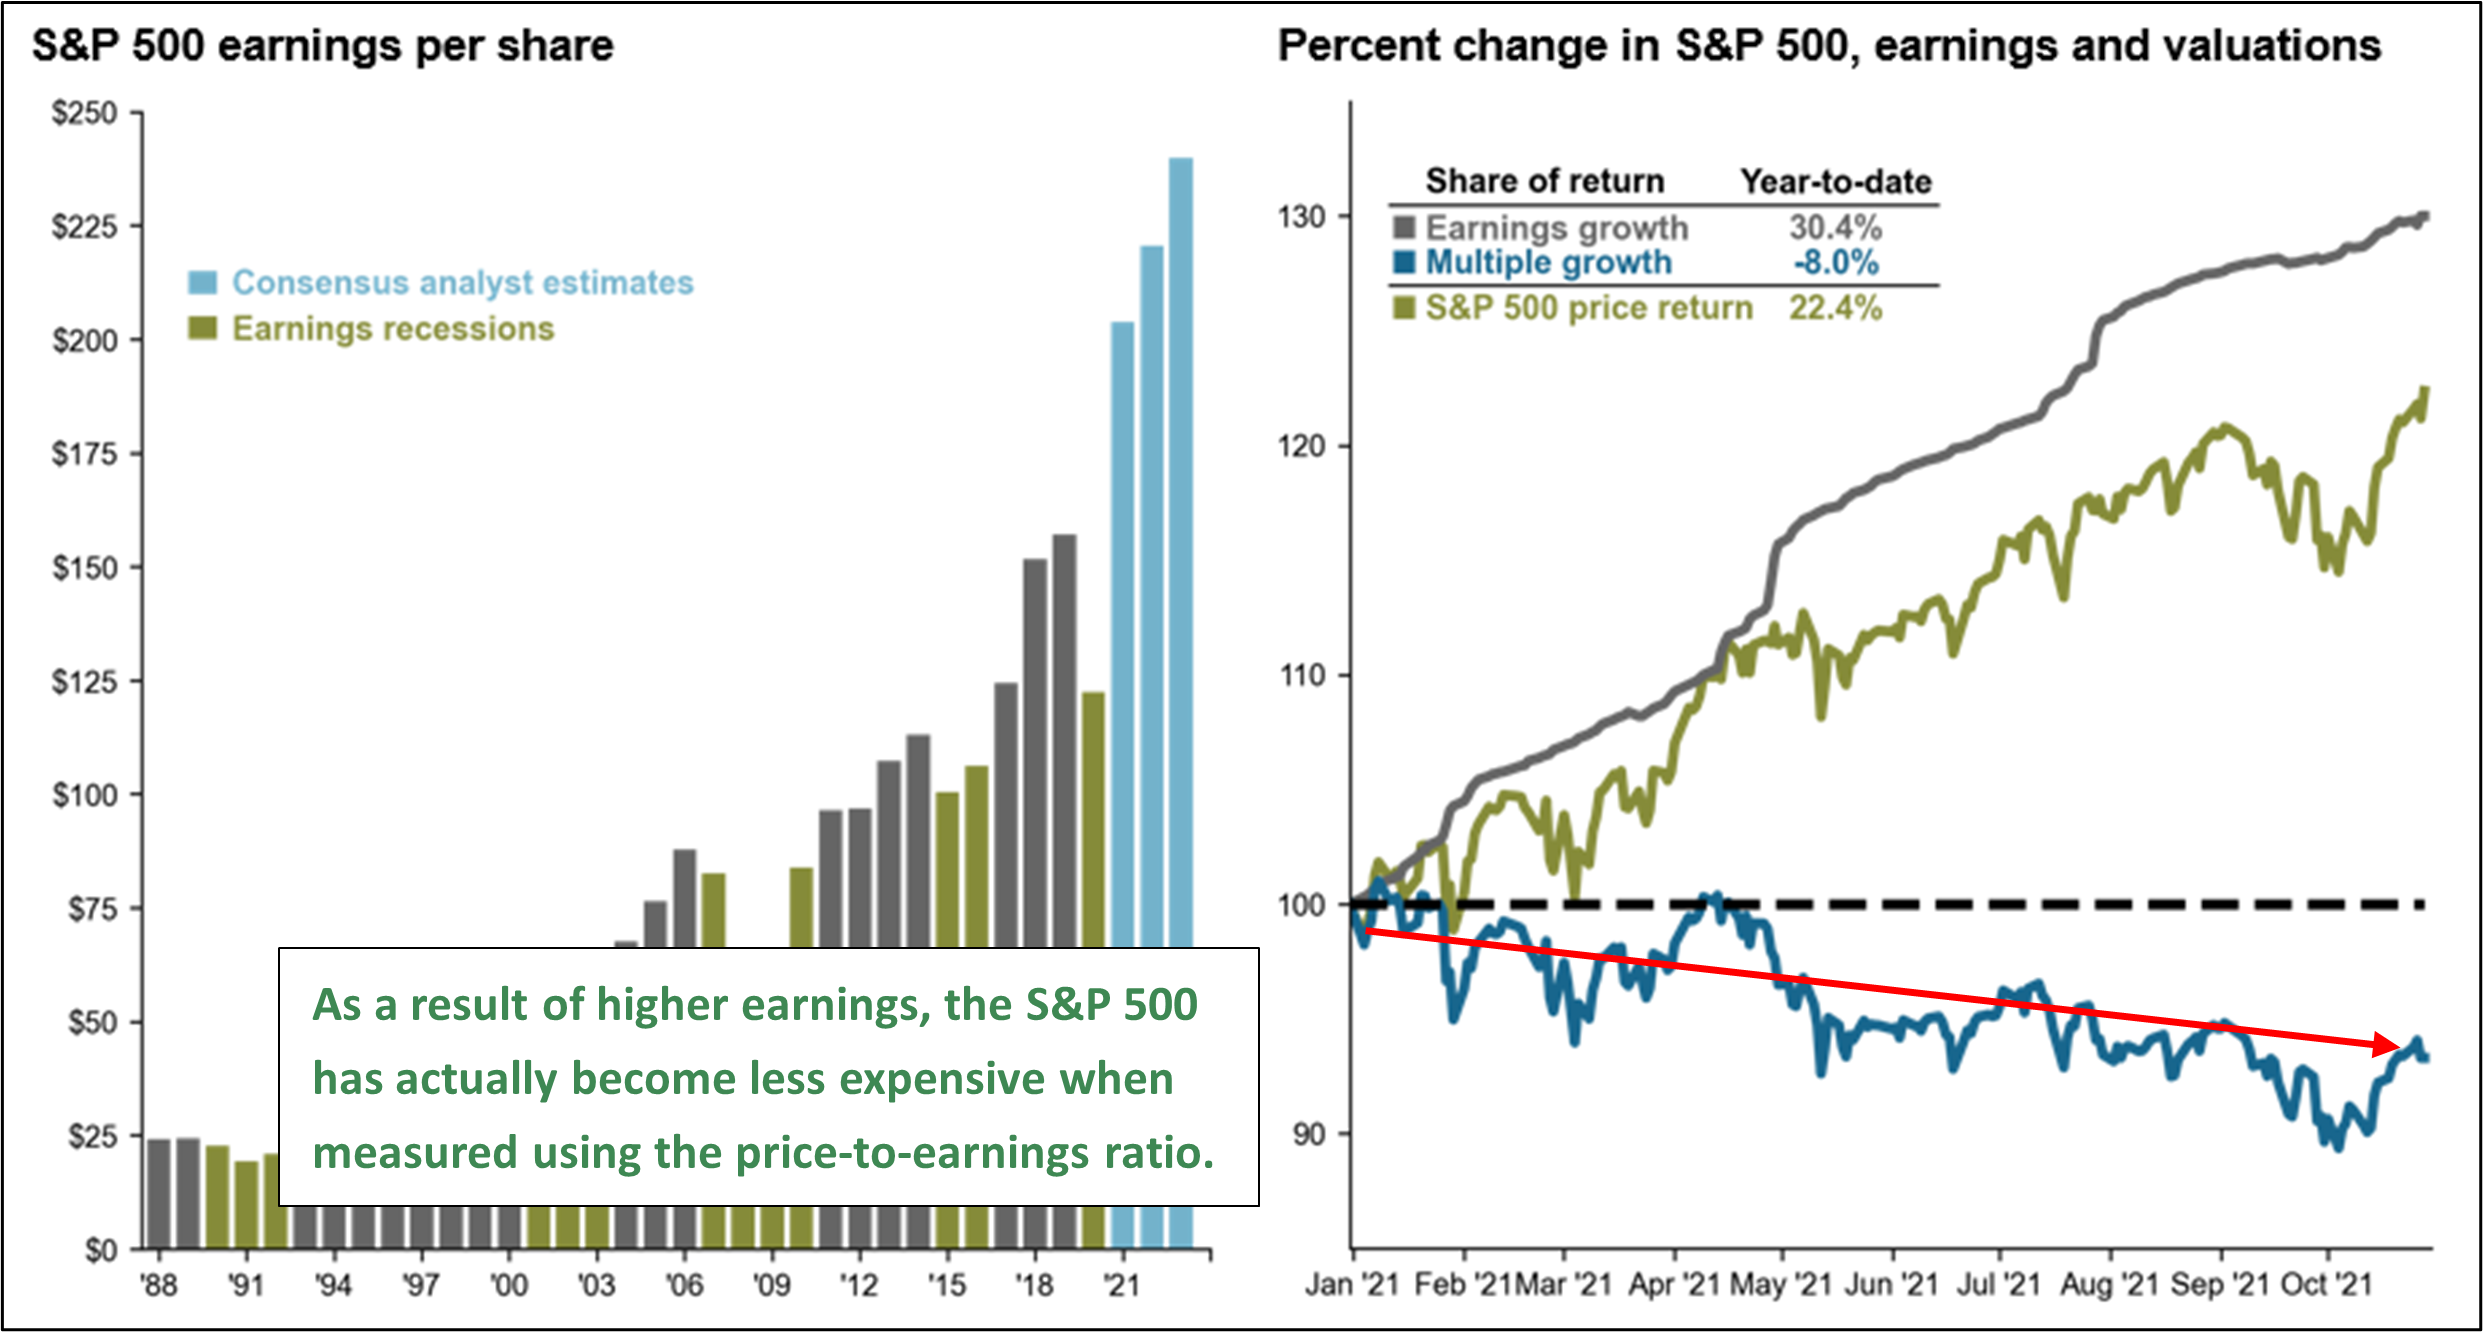
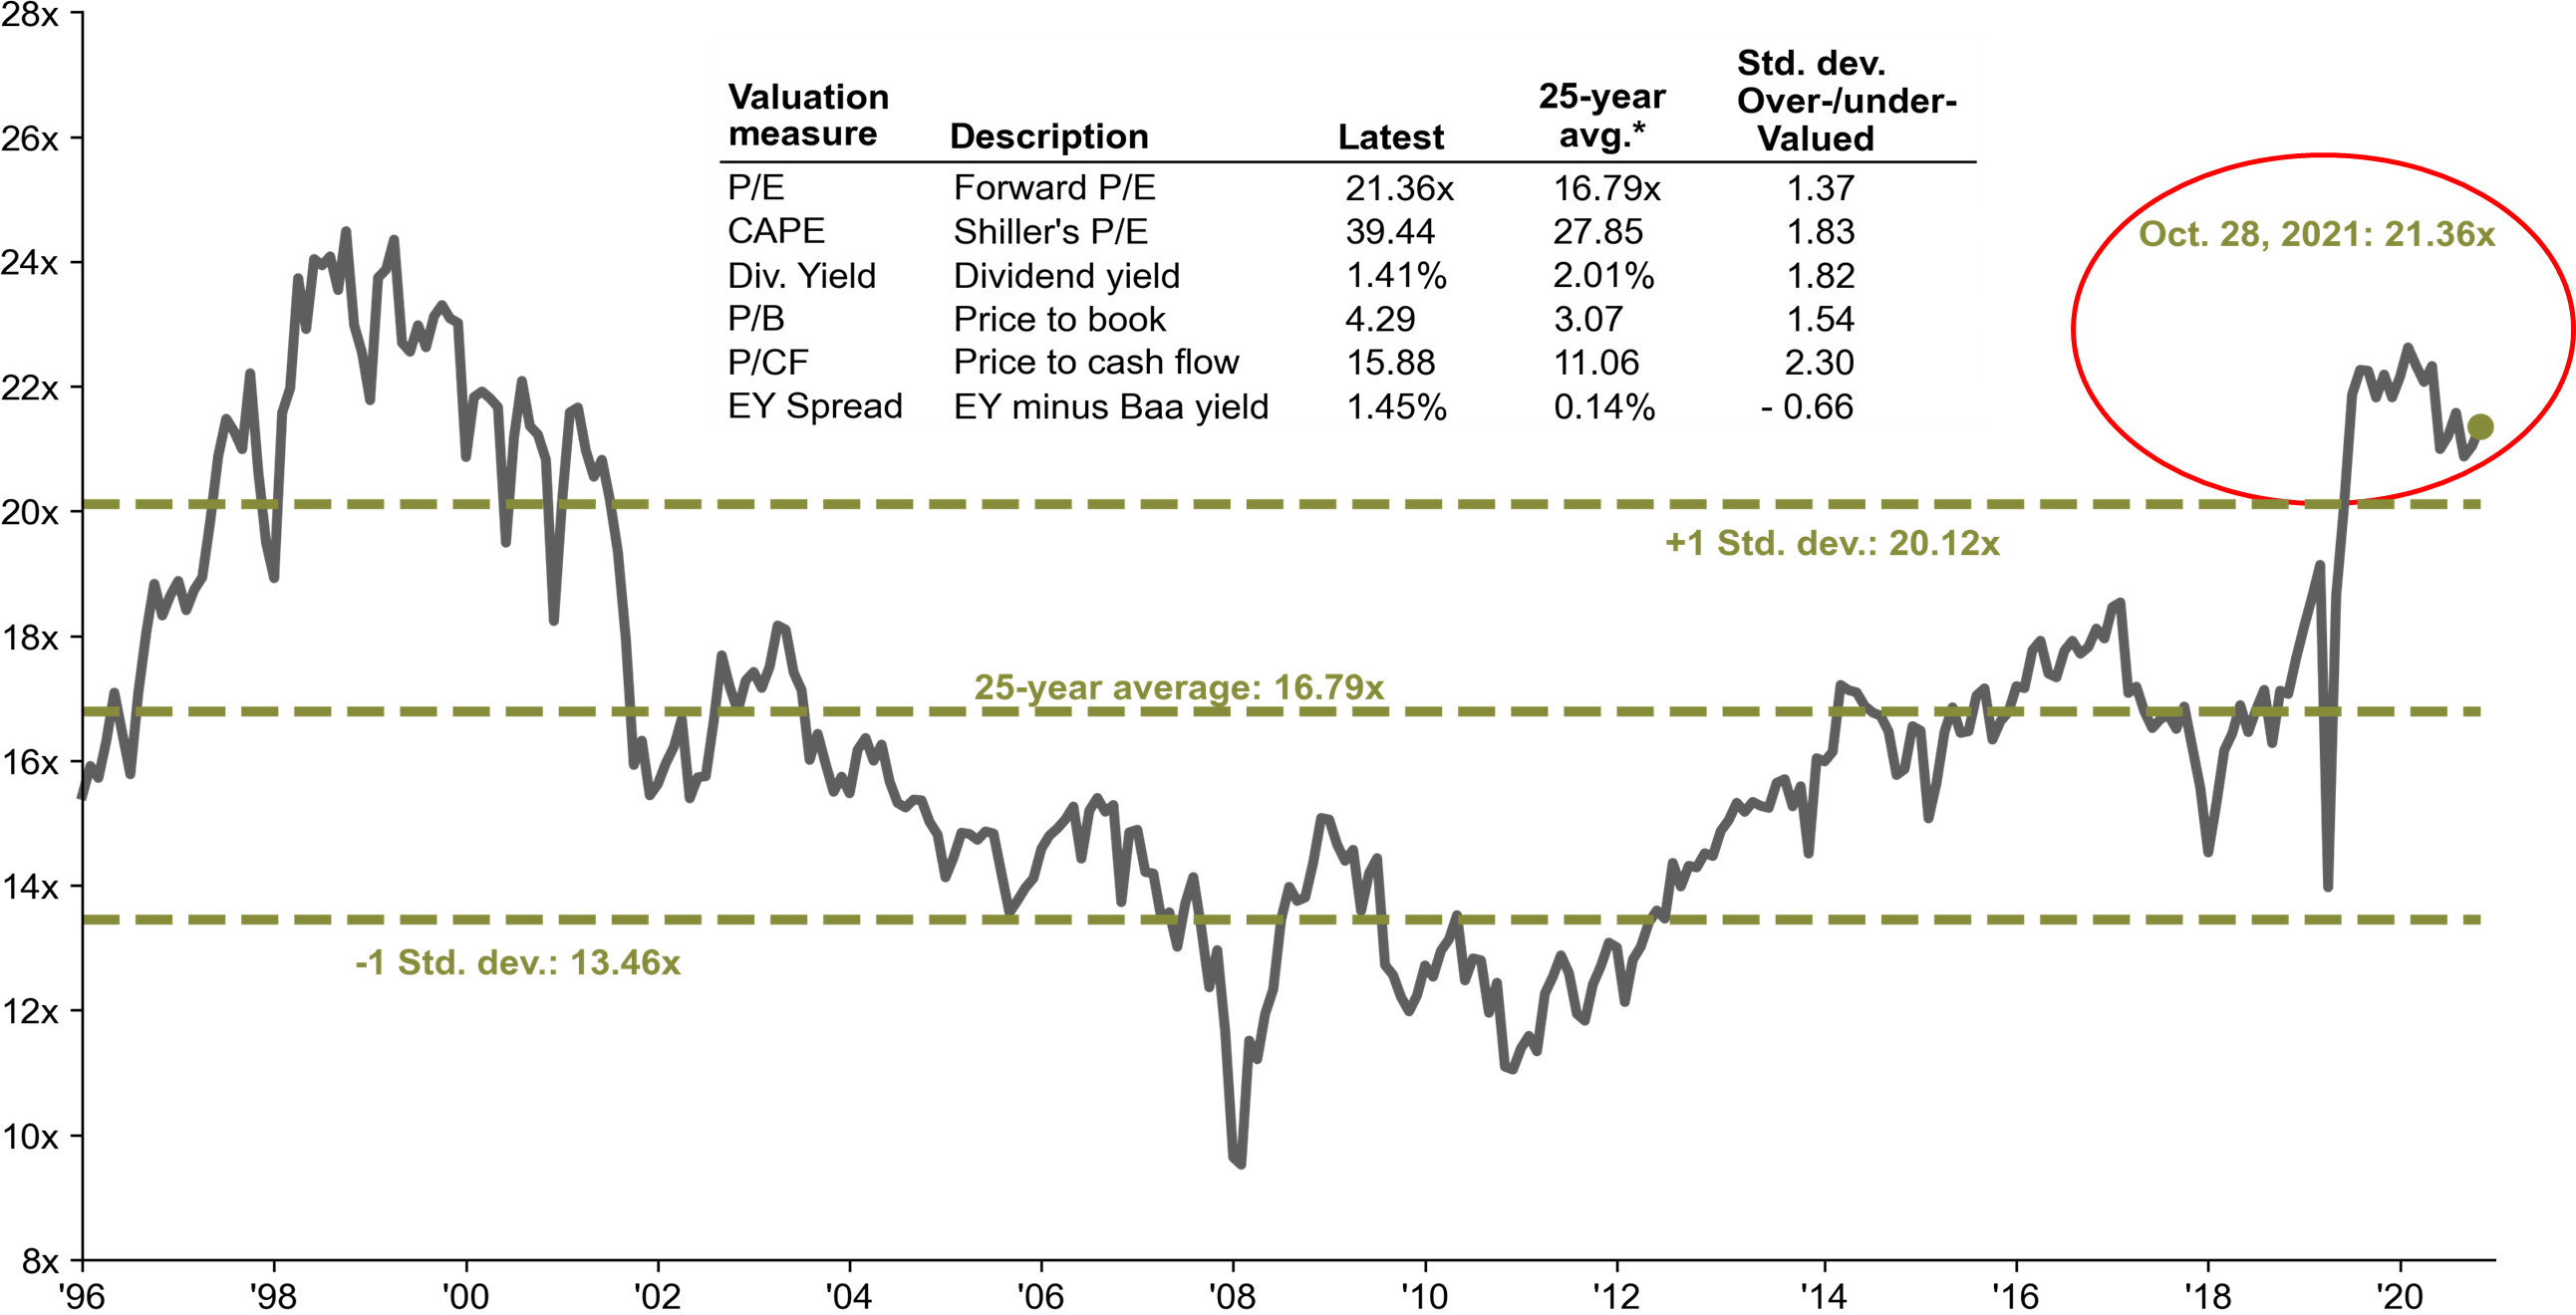
Valuation
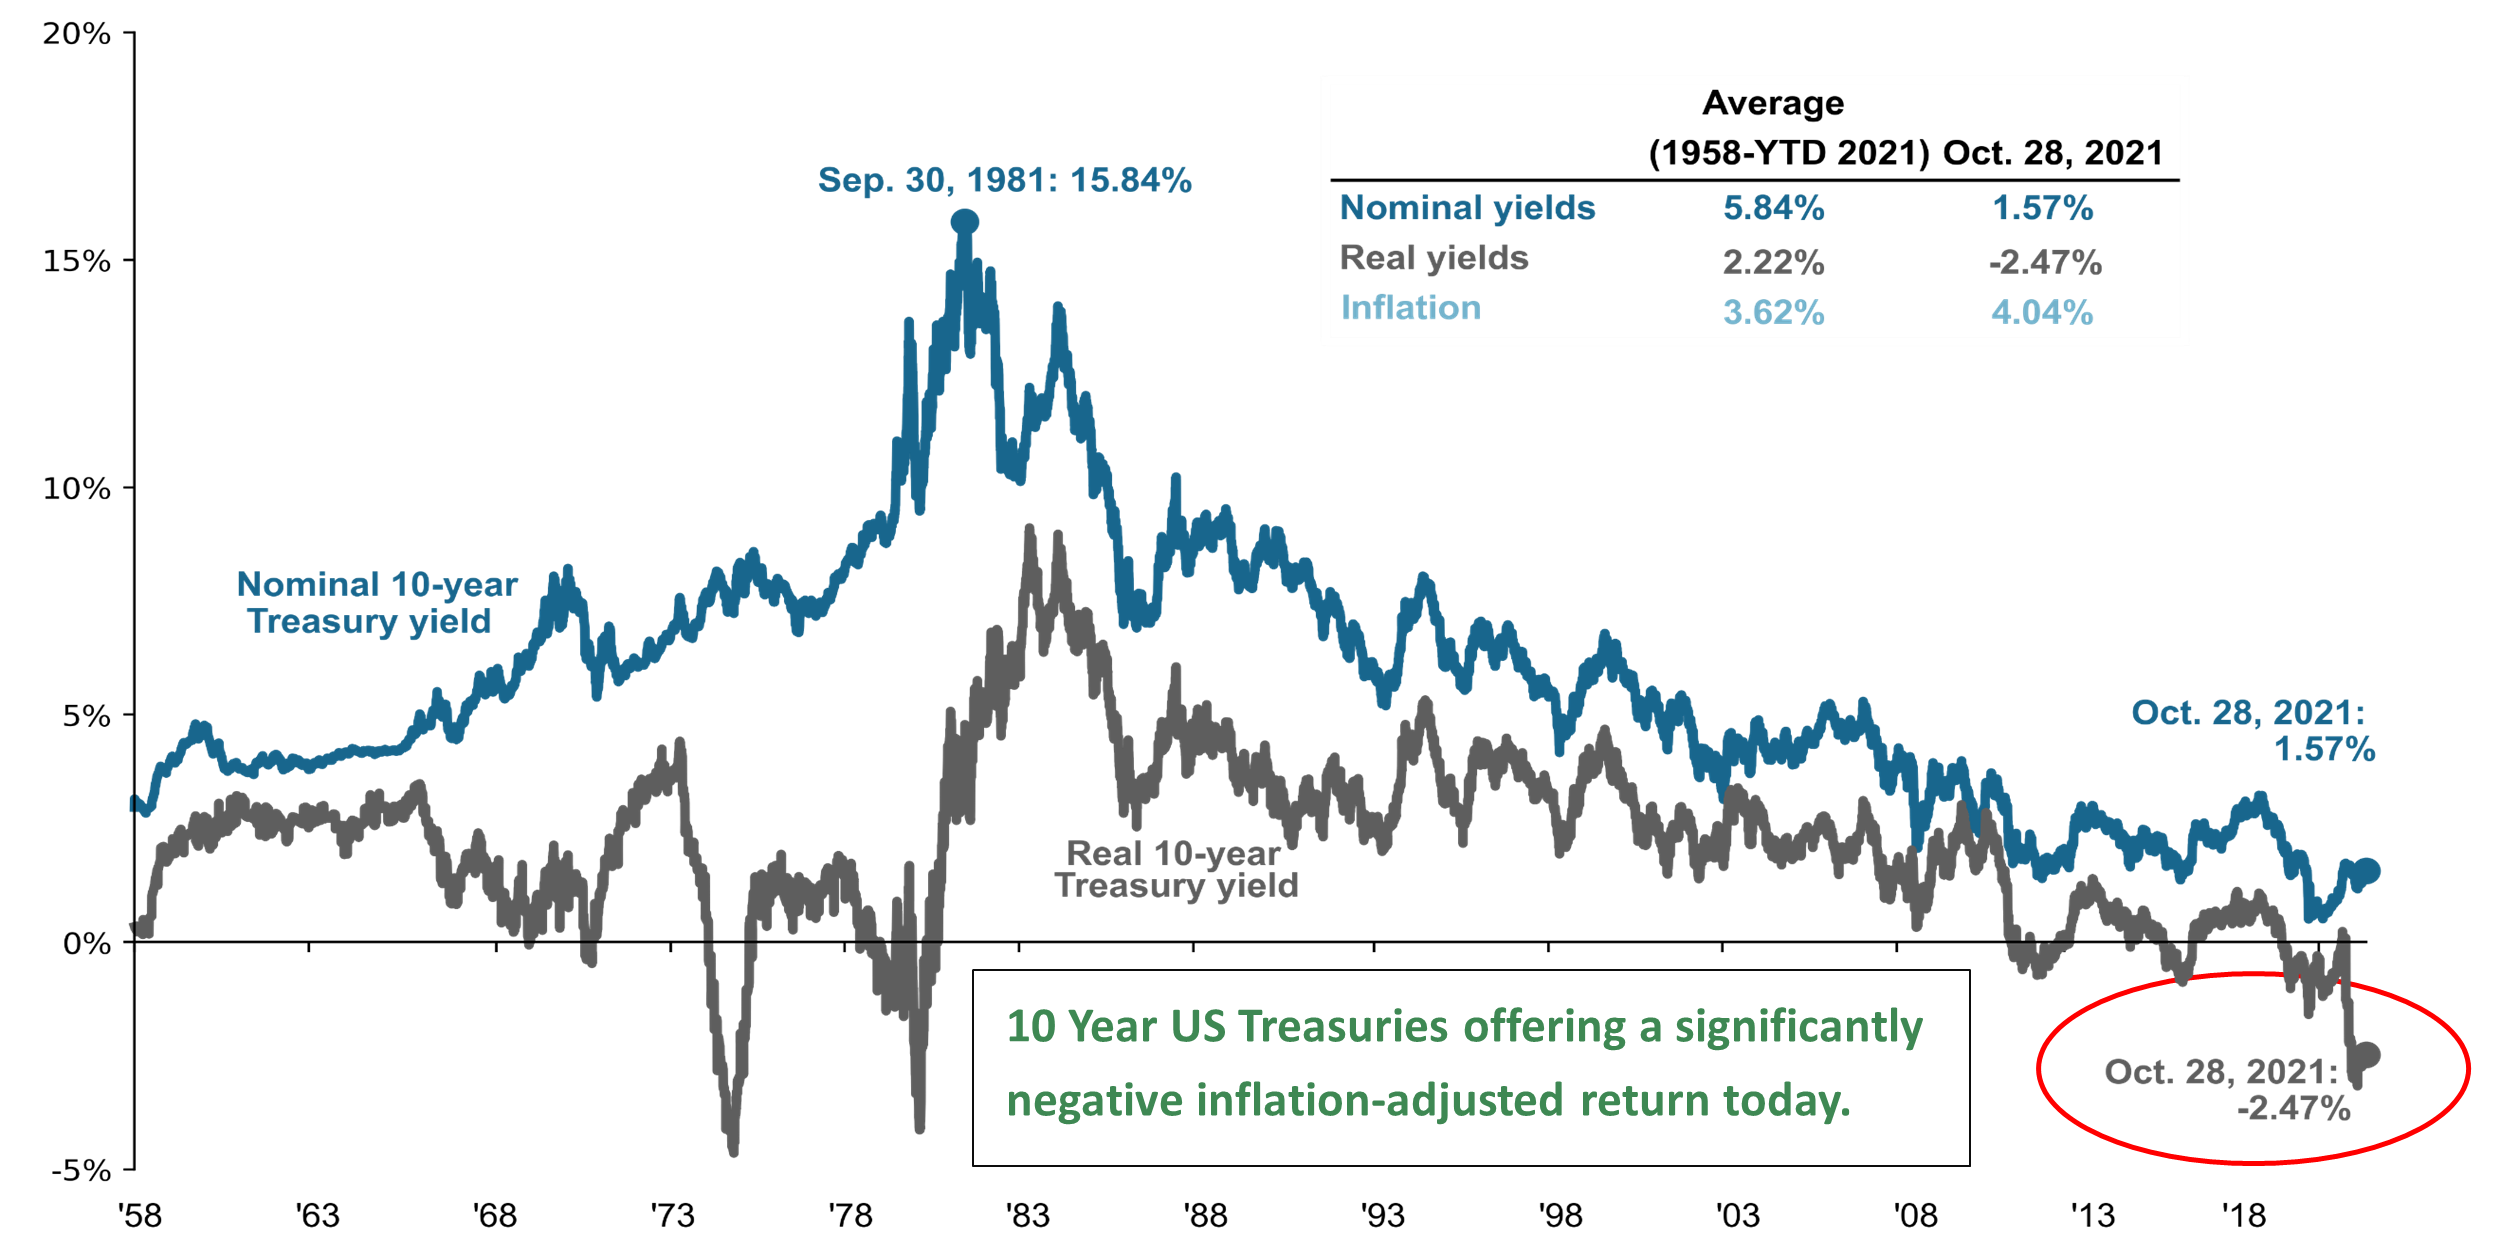
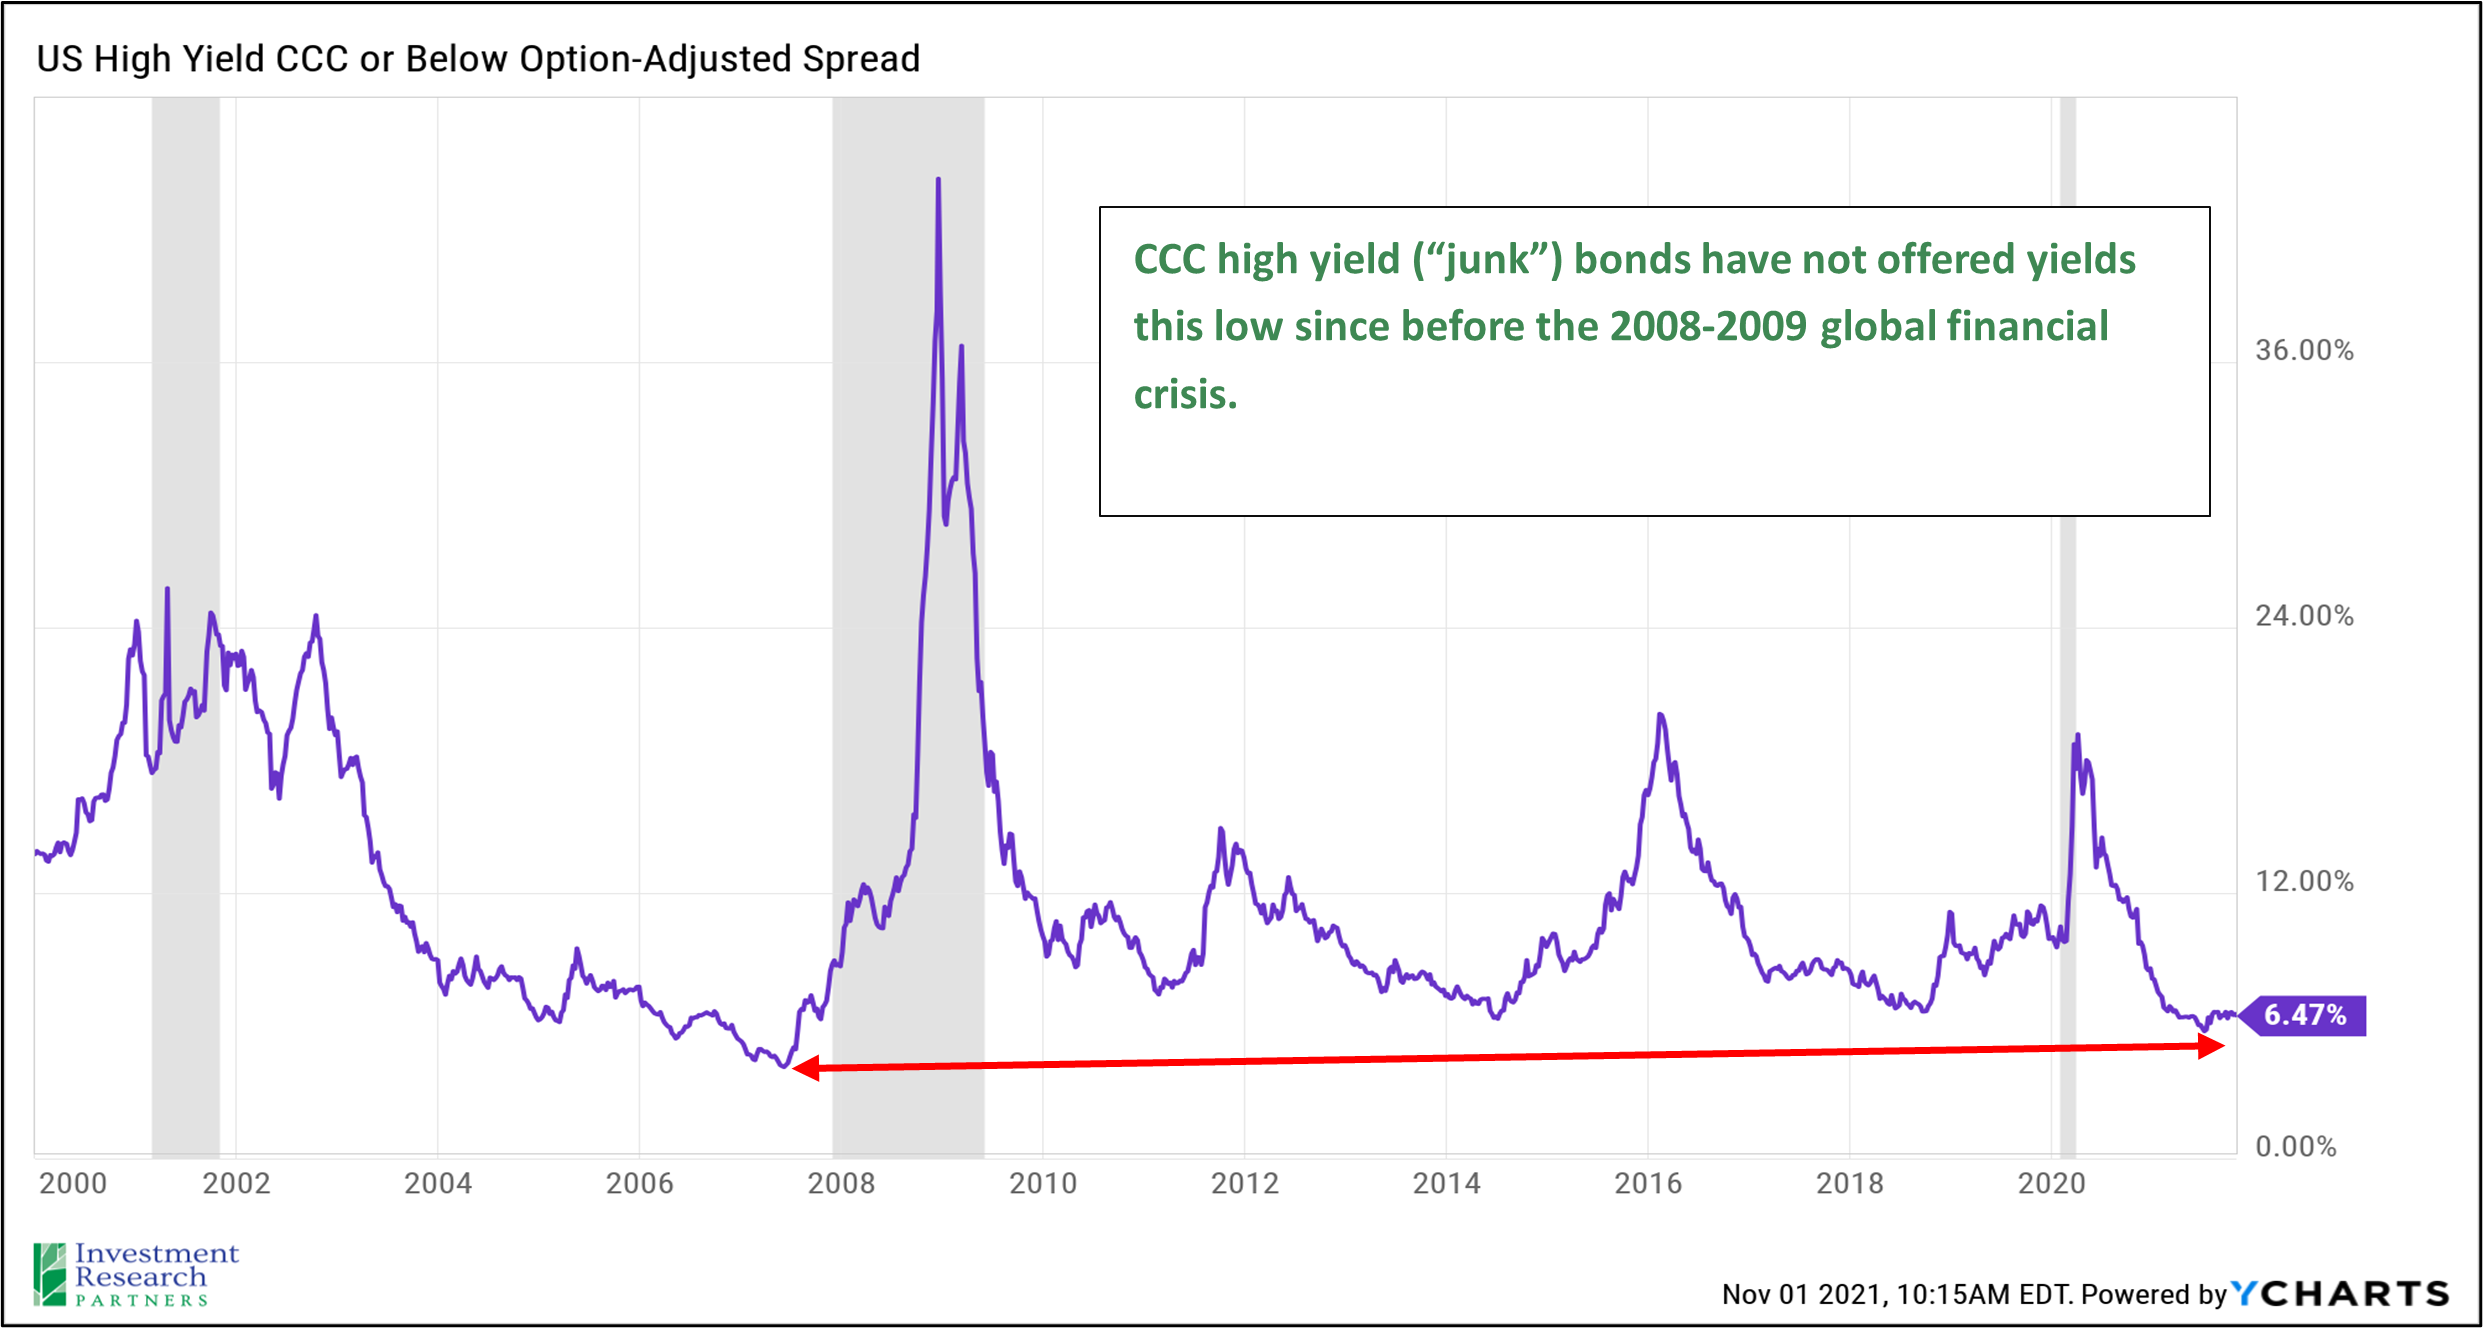
In addition to robust corporate earnings, very low US Treasury rates may also be a significant factor influencing the stock market’s march higher over the last year. Investors tend to use Treasuries for a baseline for pricing risk. In other words, “will this stock, corporate bond, etc. sufficiently compensate me in order to justify its risks relative to the perceived safety of US Treasuries?” As shown in the chart below, US Treasury bills, notes, and bonds carry at least one risk: the risk of rising costs eroding the future value of their principal and interest payments. As a result, the bond portion of the “traditional 60/40 portfolio” (60% stocks, 40% bonds) may be challenged to add value like it has in the past. As a result, we advocate that investors look to complementary solutions such as inflation-adjusted bonds and low volatility alternatives in an effort to achieve stability, liquidity, and current income for this portion of a total portfolio. Credit spreads also appear very tight today, so investors should exercise caution when considering traditional credit strategies such as high yield bonds.
Asset Class Returns
| Category | Representative Index | Oct. 2021 | YTD 2021 | Full Year 2020 |
|---|---|---|---|---|
| Global Equity | MSCI All-Country | 5.1% | 16.8% | 16.3% |
| US Large Cap Equity | S&P 500 | 7.0% | 24.0% | 18.4% |
| US Small Cap Equity | Russell 2000 | 4.3% | 17.2% | 20.0% |
| Foreign Developed Equity | MSCI EAFE | 2.5% | 11.0% | 7.8% |
| Emerging Market Equity | MSCI Emerging Markets | 1.0% | -0.3% | 18.3% |
| US High Yield Fixed Income | ICE BofAML High Yield | -0.2% | 4.5% | 6.2% |
| US Fixed Income | Barclays Aggregate Bond | 0.0% | -1.6% | 7.5% |
| Cash Equivalents | ICE BofAML 3 Mo Deposit | 0.0% | 0.0% | 0.5% |
| Source: Morningstar (total returns shown gross of fees) As of October 31, 2021 |
Prices & Interest Rates
| Representative Index | Oct. 31, 2021 | Year-End 2020 |
|---|---|---|
| S&P 500 | 4,605 | 3,756 |
| Dow Jones Industrial Avg. | 35,820 | 30,606 |
| NASDAQ | 15,498 | 12,888 |
| Crude Oil (US WTI) | $83.57 | $48.42 |
| Gold | $1,783 | $1,902 |
| US Dollar | 94.12 | 89.94 |
| 2 Year Treasury | 0.48% | 0.13% |
| 10 Year Treasury | 1.55% | 0.93% |
| 30 Year Treasury | 1.93% | 1.65% |
| Source: Bloomberg, US Treasury (total returns shown gross of fees) As of October 31, 2021 |
[1] https://www.factset.com/hubfs/Website/Resources%20Section/Research%20Desk/Earnings%20Insight/EarningsInsight_102921.pdf
Download PDF Version
Past performance may not be representative of future results. All investments are subject to loss. Forecasts regarding the market or economy are subject to a wide range of possible outcomes. The views presented in this market update may prove to be inaccurate for a variety of factors. These views are as of the date listed above and are subject to change based on changes in fundamental economic or market-related data. Please contact your Financial Advisor in order to complete an updated risk assessment to ensure that your investment allocation is appropriate.