

June 10, 2022 •OneAscent

For markets, economies, and geopolitics, 2022 has felt like all bad news. At its worst point in mid-May, the S&P 500 index (large US companies) had lost more than 20% this year before to a still-uncomfortable decline of -13% through the end of May (a loss of 20% is often the unofficial threshold that market participants often use to flag a “bear market”). Even bonds have not provided investors safe harbor this year; the Barclays Aggregate Bond Index has lost 9% [1].The challenges feel daunting with little sign of abating:
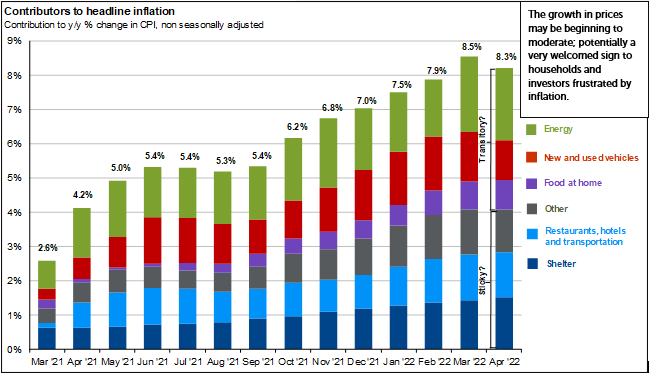
- COVID-19: While the disease is largely out of US headlines, it is still creating challenges to global supply chains and contributed to inflation (higher prices). China’s zero-COVID policy has sharply reduced manufacturing and export activity across many parts of the country.
- Russia / Ukraine: Beyond the horrific events in-country, there will be long-term global impacts on immigration as well as food and energy prices. Prior to the invasion, Russia provided 40% of the natural gas supply to Europe and 11% of global wheat production.
- Monetary Policy – As many western economies has now mostly recovered from the pandemic, the US Federal Reserve and other central banks have begun to normalize monetary policy in their respective nations following two years of very accommodative conditions. This has led to higher borrowing costs for households and businesses as the Fed seeks to cool inflation and stabilize prices without tipping the US economy into a recession.
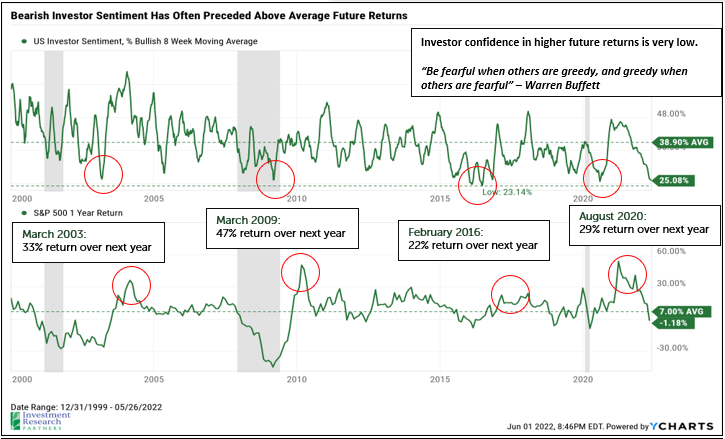
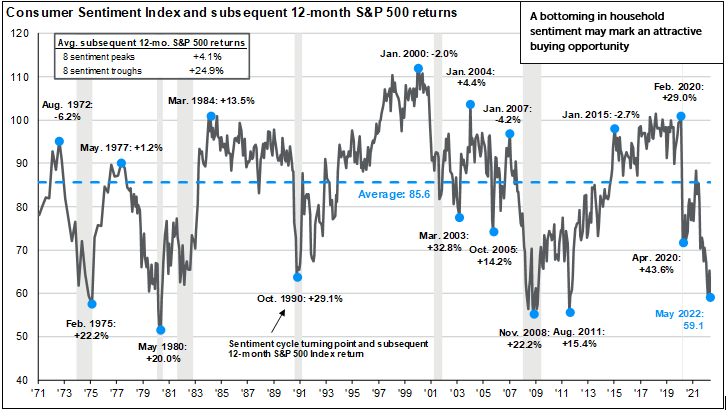
This confluence of challenges has felt overwhelming for investors, but that may be a good thing for future returns if history is any guide. Extreme levels of investor sentiment, both bullish and bearish, have historically represented good contrarian indicators. In other words, when few expect the market to go higher over the subsequent year, it often does. The first chart on the following page highlights the one-year forward return of the S&P 500 index during periods over the last two decades when investor sentiment was skewed sharply negatively compared to long-term averages. The index offered 22-47% returns over the subsequent year in the last four instances when investor sentiment was as negative as it stands today.
Implications for Portfolio Management
Markets tend to absorb and discount bad news and uncertainties, and so any “less bad” news is often met favorably by investors. Of course, markets can continue to decline in the face of worsening news, such as an escalation of the Russia / Ukraine war that spills into other European nations. Given the strength of the labor market and financial health of the average US household, we expect that the US economy will remain stable or advance for the next several quarters. But, the pressure of higher food and energy prices could have a chilling effect on the spending habits of households and the businesses. For long-term investors, the opportunity set is much more compelling today than at the end of 2021, despite the current geopolitical and economic risks. We recommend rebalancing portfolios to trim assets that have preserved value during the recent decline in favor of equities which are likely underweight in most portfolios.
 |
|
Prices & Interest Rates
| Representative Index | April 2022 | Year-End 2021 |
|---|---|---|
| Crude Oil (US WTI) | $114.67 | $75.21 |
| Gold | $1,843 | $1,828 |
| US Dollar | 101.75 | 95.97 |
| 2 Year Treasury | 2.53% | 0.73% |
| 10 Year Treasury | 2.85% | 1.52% |
| 30 Year Treasury | 3.07% | 1.90% |
| Source: Morningstar, YCharts, and US Treasury as of May 31, 2022 |
Asset Class Returns
| Category | Representative Index | May 2022 | YTD 2022 |
|---|---|---|---|
| Global Equity | MSCI All-Country World | 0.1% | -12.8% |
| Global Equity | MSCI All-Country World ESG Leaders | -0.5% | -14.1% |
| US Large Cap Equity | S&P 500 | 0.2% | -12.8% |
| US Large Cap Equity | Dow Jones Industrial Average | 0.3% | -8.4% |
| US All Cap Equity | Russell 3000 Growth | -2.3% | -22.1% |
| US All Cap Equity | Russell 3000 Value | 1.9% | -4.8% |
| US Small Cap Equity | Russell 2000 | 0.2% | -16.6% |
| Foreign Developed Equity | MSCI EAFE | 0.8% | -11.3% |
| Emerging Market Equity | MSCI Emerging Markets | 0.4% | -11.8% |
| US Fixed Income | Bloomberg Barclays Municipal Bond | 1.5% | -7.4% |
| US Fixed Income | Bloomberg Barclays US Agg Bond | 0.6% | -8.9% |
| Global Fixed Income | Bloomberg Barclays Global Agg. Bond | 0.3% | -11.1% |
| Source: YCharts as of May 31, 2022 | |||
[1] Source: YCharts
Download PDF Version
Past performance may not be representative of future results. All investments are subject to loss. Forecasts regarding the market or economy are subject to a wide range of possible outcomes. The views presented in this market update may prove to be inaccurate for a variety of factors. These views are as of the date listed above and are subject to change based on changes in fundamental economic or market-related data. Please contact your Financial Advisor in order to complete an updated risk assessment to ensure that your investment allocation is appropriate.