

July 13, 2022 •OneAscent

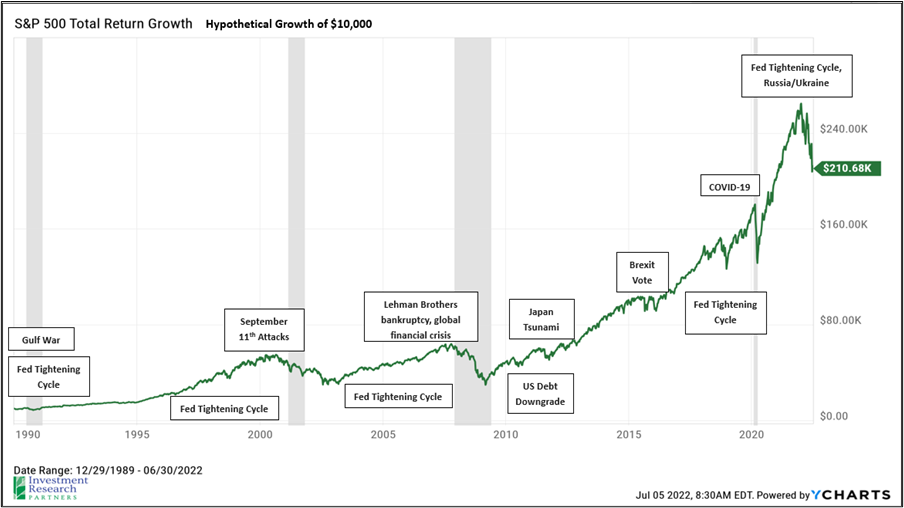
US stocks, as measured by the S&P 500 index, reached an all-time high in late December of 2021. From there, a confluence of risks and realities has sent stocks into a slide that may be referred to as a “bear market” (a 20% or greater correction). What has been uniquely painful in 2022 has been the simultaneous decline in bonds, which lost more than 10% during the first half of 2022. [1].Higher quality bonds typically offer some respite to a balanced portfolio during periods of equity market stress, but the catalysts for the decline in 2022 challenged this historical relationship. As a result, a typical “60/40” portfolio of 60% S&P 500 and 40% Barclays Aggregate Bond Index declined more than 16% in the first half of 2022.
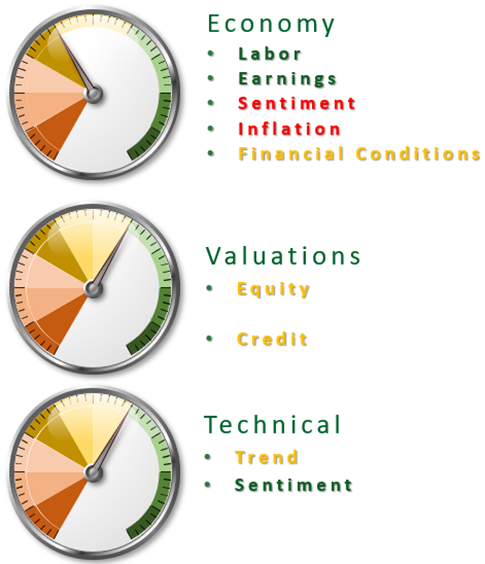
Below is a summary of our opinion and outlook for the US economy and markets, and the letter that follows provides more detail regarding the activities of 2022 so far, and how that influences recommended positioning going forward.
 |
|
Why is this Happening?
1. Inflation. The Consumer Price Index (CPI) had been advancing at a 5-7% annualized rate during the second half of 2021, which was already meaningfully higher than the 2-3% annual rate that we have experienced for much of the last decade. The CPI tracks a basket of commonly purchased items such as housing, automobiles, energy, food, and leisure activities. The robust reopening of the economy paired with knock-on effects of the pandemic, most notably supply chain disruptions and worker shortages, as well as low mortgage rates, which increased demand / prices for homes, were all contributing to higher costs before the war in Ukraine.
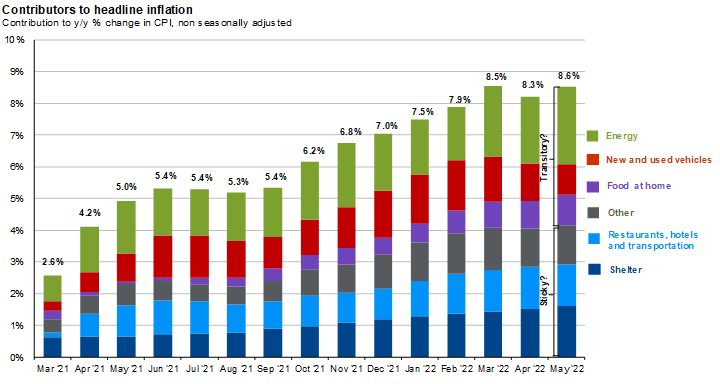
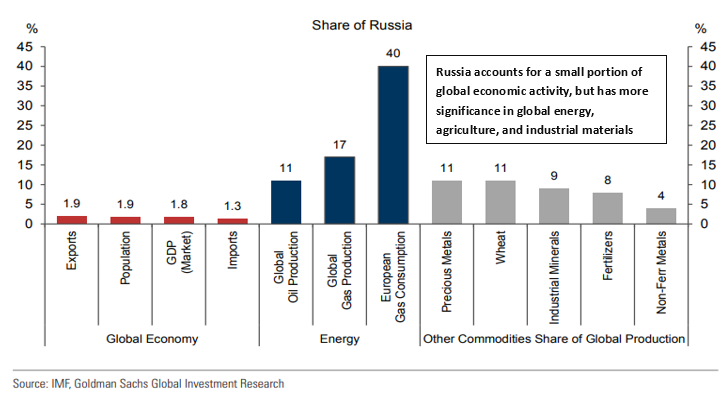
2. Russia / Ukraine. The Consumer Price Index (CPI) had been advancing at a 5-7% annualized rate during the second half of 2021, which was already meaningfully higher than the 2-3% annual rate that we have experienced for much of the last decade. The CPI tracks a basket of commonly purchased items such as housing, automobiles, energy, food, and leisure activities. The robust reopening of the economy paired with knock-on effects of the pandemic, most notably supply chain disruptions and worker shortages, as well as low mortgage rates, which increased demand / prices for homes, were all contributing to higher costs before the war in Ukraine.
3. Monetary Policy. The US Federal Reserve follows a dual mandate of price stability and maximum employment. The objective of maximum employment has been achieved following massive pandemic-induced layoffs, but accomplishing the goal of price stability has been anything but easy for monetary policy makers in 2022. The Fed had anchored short-term interest rates near zero for the last two years in an effort to support the economy during the pandemic while simultaneously buying longer-term securities in order to provide liquidity and depress longer-term interest rates (which served to hold down mortgage rates, spurring demand in the housing market). Going into 2022, it was widely expected that the Fed would embark on a path to normalize monetary policy, but what has been surprising to market participants has been the central bank’s pace at which it intends to raise interest rates, which has had broader impacts on how investors price the risks of holding equities and corporate bonds given that the “risk-free rate” of interest has increased (i.e., the rate an investor can earn through short-term Treasury and money-market instruments).
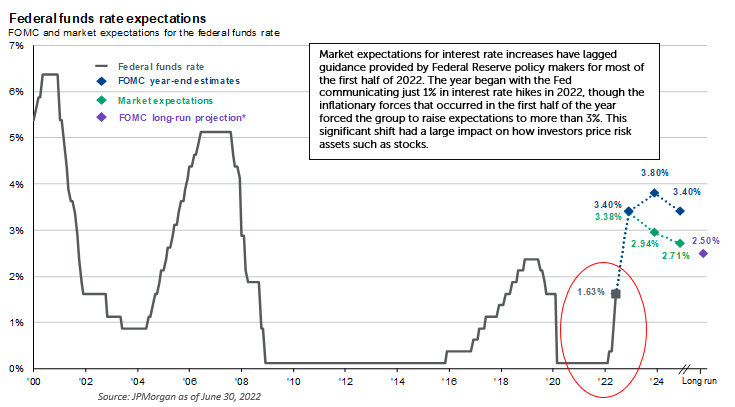
4. Risk assets will reprice lower (all else equal). The base lending rate, or “Fed funds rate”, impacts how investors evaluate the fair value of a given asset. For example, a preferred stock, and the various risks associated with it, that yields 6% becomes less attractive when a risk-free asset like a short-term Treasury bill earns 3% instead of zero. The preferred stock should, all else equal, reprice lower to compensate an investor for the opportunity cost. In a more extreme example, if short-term Treasury bills earned 6% (not expected any time soon), no rational investor would ever buy the 6% preferred stock; it would have to reprice lower. As inflation has influenced the Fed to raise interest rates faster than expected and to a greater degree than expected, that has caused a repricing lower of most risk assets this year, including stocks.
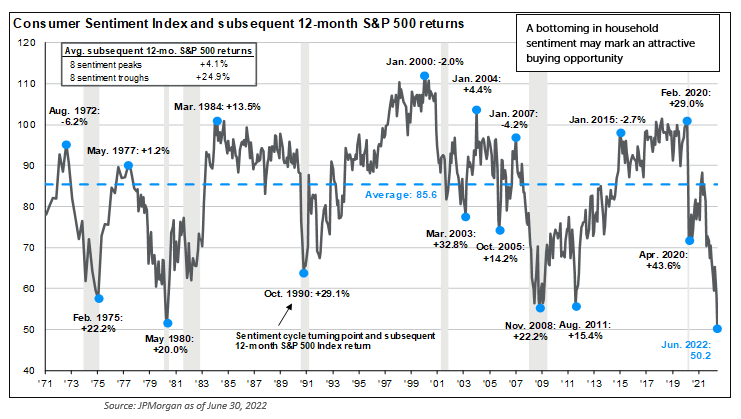
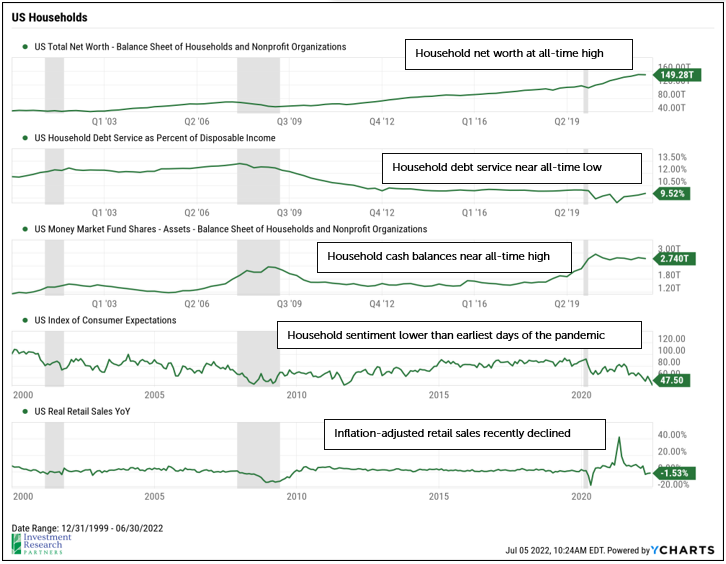
5. Sentiment. The average American household, when surveyed about their feelings of their financial condition and economic outlook, are more concerned today than any time in the last 50 years! When asked why, inflation and its eroding effect on living standards is one of the most commonly cited answers. Simultaneously, asset prices have been in decline, mortgage rates have been rising, and stimulus checks are a thing of the past. Outside of a healthy labor market, the American household is being squeezed. A psychological shift among households where spending declines meaningfully could have a material adverse impact on the economy, but may also serve to cool inflation, giving the Federal Reserve some cover to normalize monetary policy more gradually.
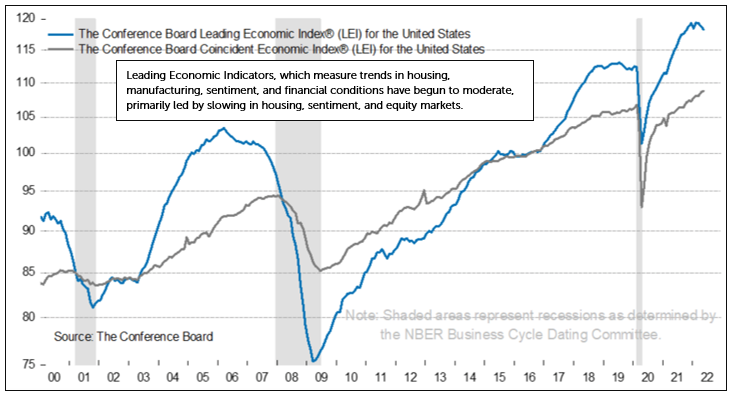
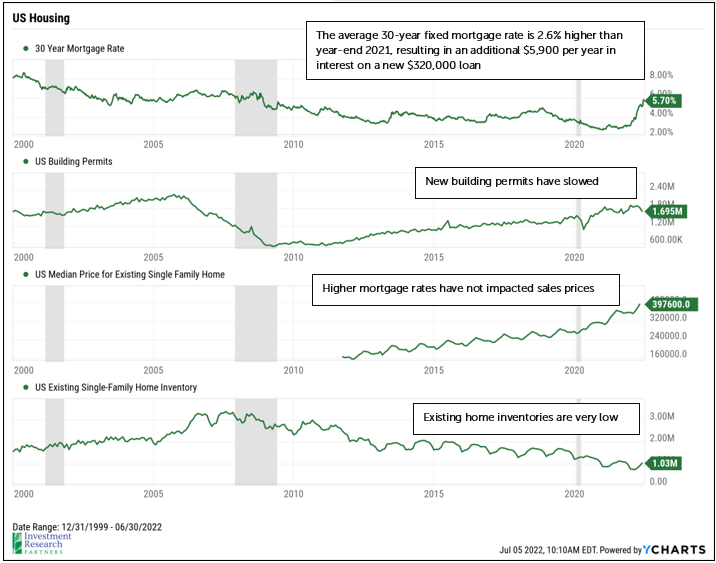
6. Slowing Economic Growth. While the Federal Reserve has only increased interest rates by 1.5% this year in an effort to cool inflation, some of their work may have already been achieved by higher mortgage rates and gasoline prices creating a damper on demand. Data points that typically imply the future economic direction of the economy, such as the housing market and manufacturing activity, have already started to soften.
What has changed?
Interest rates, uncertainty, and volatility are all higher while stock and bond prices are lower than the beginning of the year. While uncomfortable, today is likely a better time to invest than six months ago. And, the challenges we’ve faced as a planet in the last three years will undoubtedly lead to a future that is meaningfully different than the present (and potentially expedite existing trends). For example, higher energy prices may hasten the transition to renewable energy and electric vehicles, the shift toward remote and flexible work may lead to more diversity of populations and wealth as employees relocate away from more expensive coastal cities, and geopolitical tensions as well as supply chain challenges exposed during the pandemic are already leading to a re-shoring of manufacturing in the US.
What is going well?
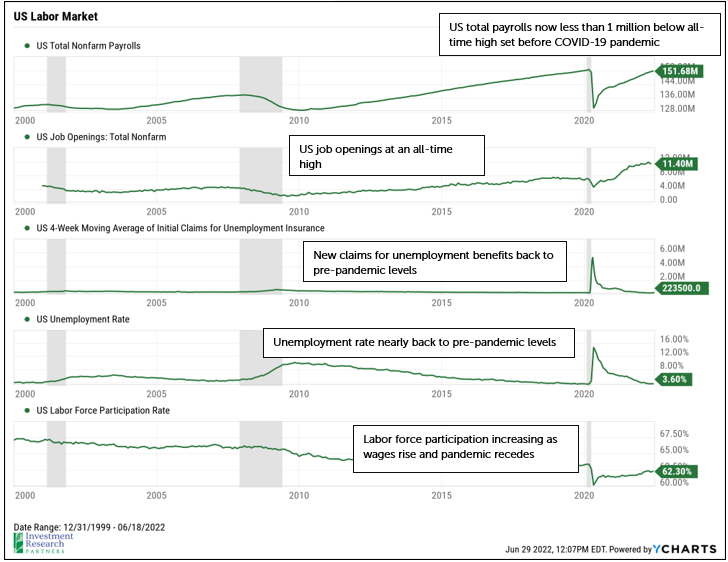
The labor market remains healthy and a pillar of economic stability. The Fed’s path to normalizing monetary policy and controlling inflation may be showing signs of being effective, though it has had some shorter-term adverse impacts on stock and bond prices. In aggregate, large cap stock earnings have remained relatively resilient in the face of inflation and supply chain challenges, and are expected to continue to grow in 2022. Reporting of second quarter earnings is ramping up as of this writing, so it will be important to see if that resiliency holds, and it is very likely that there will be a wide dispersion of earnings outcomes this quarter.
What is going poorly?
Inflation remains stubbornly high, investor and consumer sentiment are both low, and economic growth is slowing.
What are the biggest risks?
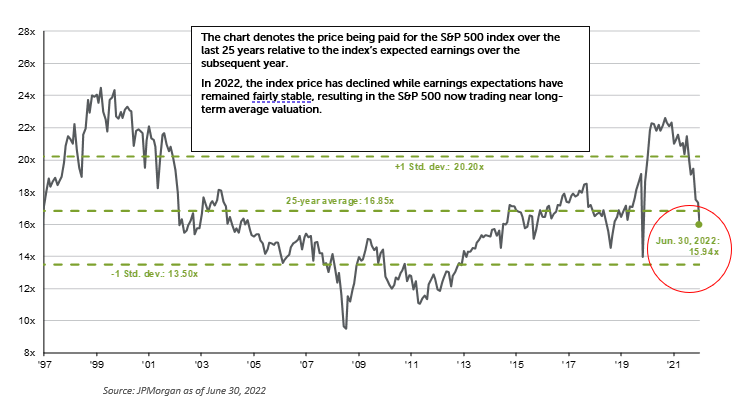
Beyond the unpredictable risks like escalation of the Ukraine conflict into broader Europe or some other natural disaster, one potential risk today may be that corporate earnings expectations are too high. Despite higher borrowing and labor costs as well as the potential for slowing household spending, estimates for S&P 500 earnings have remained relatively stable at 10% growth in 2022.
Additionally, and as we have discussed previously, the Fed’s attempt to rein in inflation by raising rates and shrinking their balance sheet does bring with it the risk of tipping the US economy into recession.
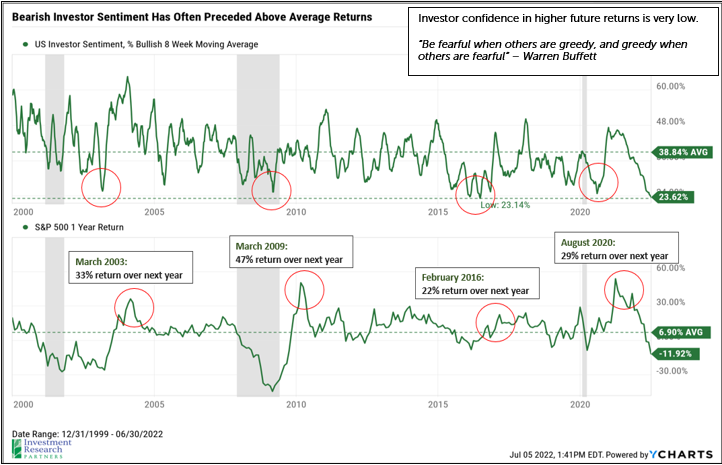
What are the biggest opportunities?
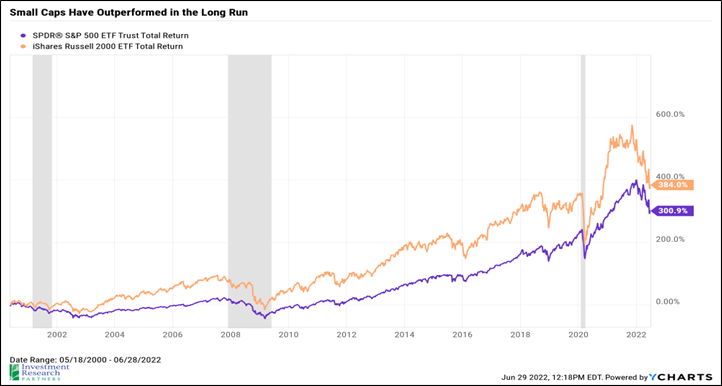
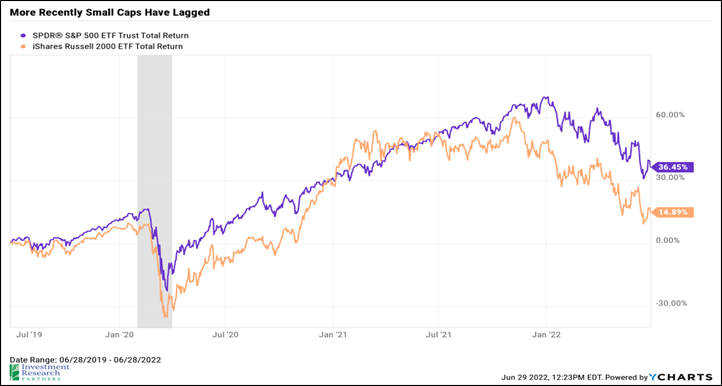
For investors with long time horizons, stocks are now meaningfully less expensive than they were six months ago. This is true for the market as a whole, and potentially more true in specific areas such as smaller companies which tend to have more economic sensitivity. Small cap stocks have lagged large caps significantly over the last several quarters, despite a record of longer-term outperformance, and now trade at one of their lowest valuation relationships relative to large cap stocks in several years.
Implications for Portfolio Management
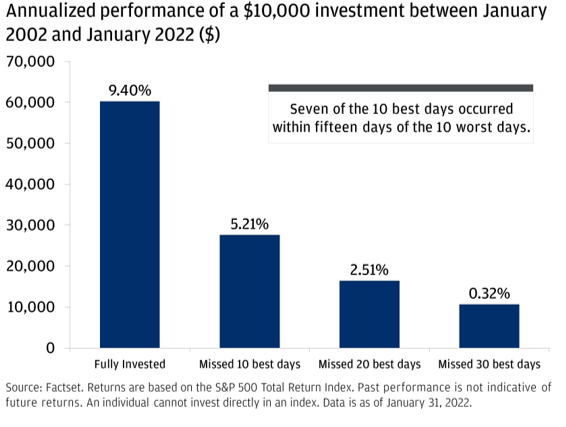
When asked about the length of our investing time horizon, many of us will answer in years. But, when asked how often we look at our performance, the answer is often measured in days, months, or at the most, quarters. If we thought the S&P 500 would march consistently higher and outperform all other asset classes, that’s all we would own and advise clients to own. However, the cycles of investing are much less predictable than we would prefer, so holding a diversified portfolio of many companies, industries, and asset types helps to smooth the ride toward achieving one’s long-term financial goals. Why try to smooth the ride? Because, most people, professionals included, can make drastic or even catastrophically bad decisions when faced with stress and declines in wealth.
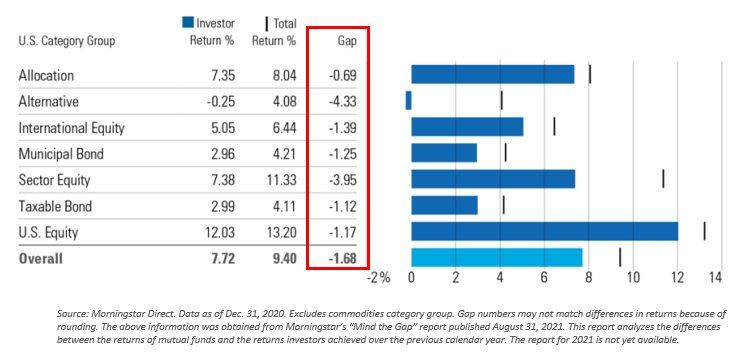
This point is best illustrated by an annual study performed by Morningstar which measures actual investors’ dollar-weighted return on investment into mutual funds versus simply buying and holding the funds. The takeaway: investors buy and sell at the wrong time, likely driven by emotion, and the gap between investors’ actual returns and fund returns is wider for more volatile and more complex investments. What’s the point of having a high returning portfolio if we don’t have the stomach to actually hold it through volatility periods in order to capture those long-term gains? This is why, as wealth managers and as portfolio managers, we not only seek to help our clients select a portfolio that is appropriate for their financial situation and long-term goals, but we also seek to minimize volatility and smooth the ride as much as possible.
Prices & Interest Rates
| Representative Index | April 2022 | Year-End 2021 |
|---|---|---|
| Crude Oil (US WTI) | $105.76 | $75.21 |
| Gold | $1,804 | $1,828 |
| US Dollar | 104.69 | 95.97 |
| 2 Year Treasury | 2.92% | 0.73% |
| 10 Year Treasury | 2.98% | 1.52% |
| 30 Year Treasury | 3.14% | 1.90% |
| Source: Morningstar, YCharts, and US Treasury as of June 30, 2022 |
Asset Class Returns
| Category | Representative Index | May 2022 | YTD 2022 |
|---|---|---|---|
| Global Equity | MSCI All-Country World | -8.4% | -20.2% |
| Global Equity | MSCI All-Country World ESG Leaders | -7.9% | -20.8% |
| US Large Cap Equity | S&P 500 | -8.3% | -20.0% |
| US Large Cap Equity | Dow Jones Industrial Average | -6.6% | -14.4% |
| US All Cap Equity | Russell 3000 Growth | -7.8% | -28.2% |
| US All Cap Equity | Russell 3000 Value | -8.8% | -13.2% |
| US Small Cap Equity | Russell 2000 | -8.2% | -23.4% |
| Foreign Developed Equity | MSCI EAFE | -9.3% | -19.6% |
| Emerging Market Equity | MSCI Emerging Markets | -6.6% | -17.6% |
| US Fixed Income | Bloomberg Barclays Municipal Bond | -1.6% | -9.0% |
| US Fixed Income | Bloomberg Barclays US Agg Bond | -1.6% | -10.4% |
| Global Fixed Income | Bloomberg Barclays Global Agg. Bond | -3.2% | -13.9% |
| Source: YCharts as of June 30, 2022 | |||
[1] Bloomberg Barclays US Aggregate Bond Index (Source: YCharts)
Download PDF Version
Past performance may not be representative of future results. All investments are subject to loss. Forecasts regarding the market or economy are subject to a wide range of possible outcomes. The views presented in this market update may prove to be inaccurate for a variety of factors. These views are as of the date listed above and are subject to change based on changes in fundamental economic or market-related data. Please contact your Financial Advisor in order to complete an updated risk assessment to ensure that your investment allocation is appropriate.