

February 8, 2022 •OneAscent

January was an ugly start to the year for the capital markets with the S&P 500 index declining more than 11% at its worst point before recovering to a loss of 5% for the month. While there were ancillary concerns such as corporate earnings, inflation, and geopolitical risks (e.g., Russia / Ukraine), it seemed as though the path of monetary policy was the primary force that drove markets lower. Central banks globally have begun the process of paring back their ultra-accommodative monetary policies that were enacted to combat the negative impact on their economies that resulted from the global pandemic. Our central bank, the US Federal Reserve, communicated in January their intention to follow suit by likely raising base lending rates to 0.75%-1.00% in 2022 as well as to end their systematic program of purchasing fixed income securities that helped to provide stability and liquidity to fixed income markets and artificially depress long-term interest rates. Additionally, it was implied that the US Federal Reserve could begin to reduce its holdings of fixed income securities sooner than expected, potentially later this year.
What does this all mean for the economy and investors?
- The US economy is growing. The members of the Federal Reserve’s Open Markets Committee (FOMC) would likely not embark on a path toward monetary policy normalization if the economy was not showing healthy signs of stabilization.
- Ultra-accommodative monetary policy and fiscal stimulus have contributed to inflation. Inflation, or rising costs, occurs when there are imbalances in supply and demand for a good or service. The pandemic has led to many imbalances globally, driven both by shortages in supply (e.g., factory shutdowns) and excessive demand (e.g., cash-rich households eager to spend stimulus checks). We anticipate that many of these imbalances will naturally correct as the pandemic recedes, but the Fed is also doing its part to cool inflation given their dual mandate of seeking full employment and price stability (very unstable prices for goods and services could create uncertainty and volatility in the real economy, potentially leading to recession). Extreme monetary and fiscal policies have also caused asset price inflation; more on this in item 5.
- Savings rates and borrowing costs will likely rise. Savers can expect to earn greater interest on their cash but borrowing money will likely cost more. For example, just in the month of January, the interest rate on a six-month US Treasury bill increased from 0.2% to 0.5%. However, the average 30-year fixed rate mortgage cost rose from 3.1% to 3.6% during that same period, meaning the monthly principal and interest cost of a new $300,000 mortgage would rise from approximately $1,250 to $1,350, an additional $1,200 per year. All else equal, this will serve to reduce home price inflation given the now lower supply of capital for home purchases. This is just one example; the same dynamic could exist across multiple types of consumer and business loans (lessening demand for goods and services resulting from higher borrowing costs).
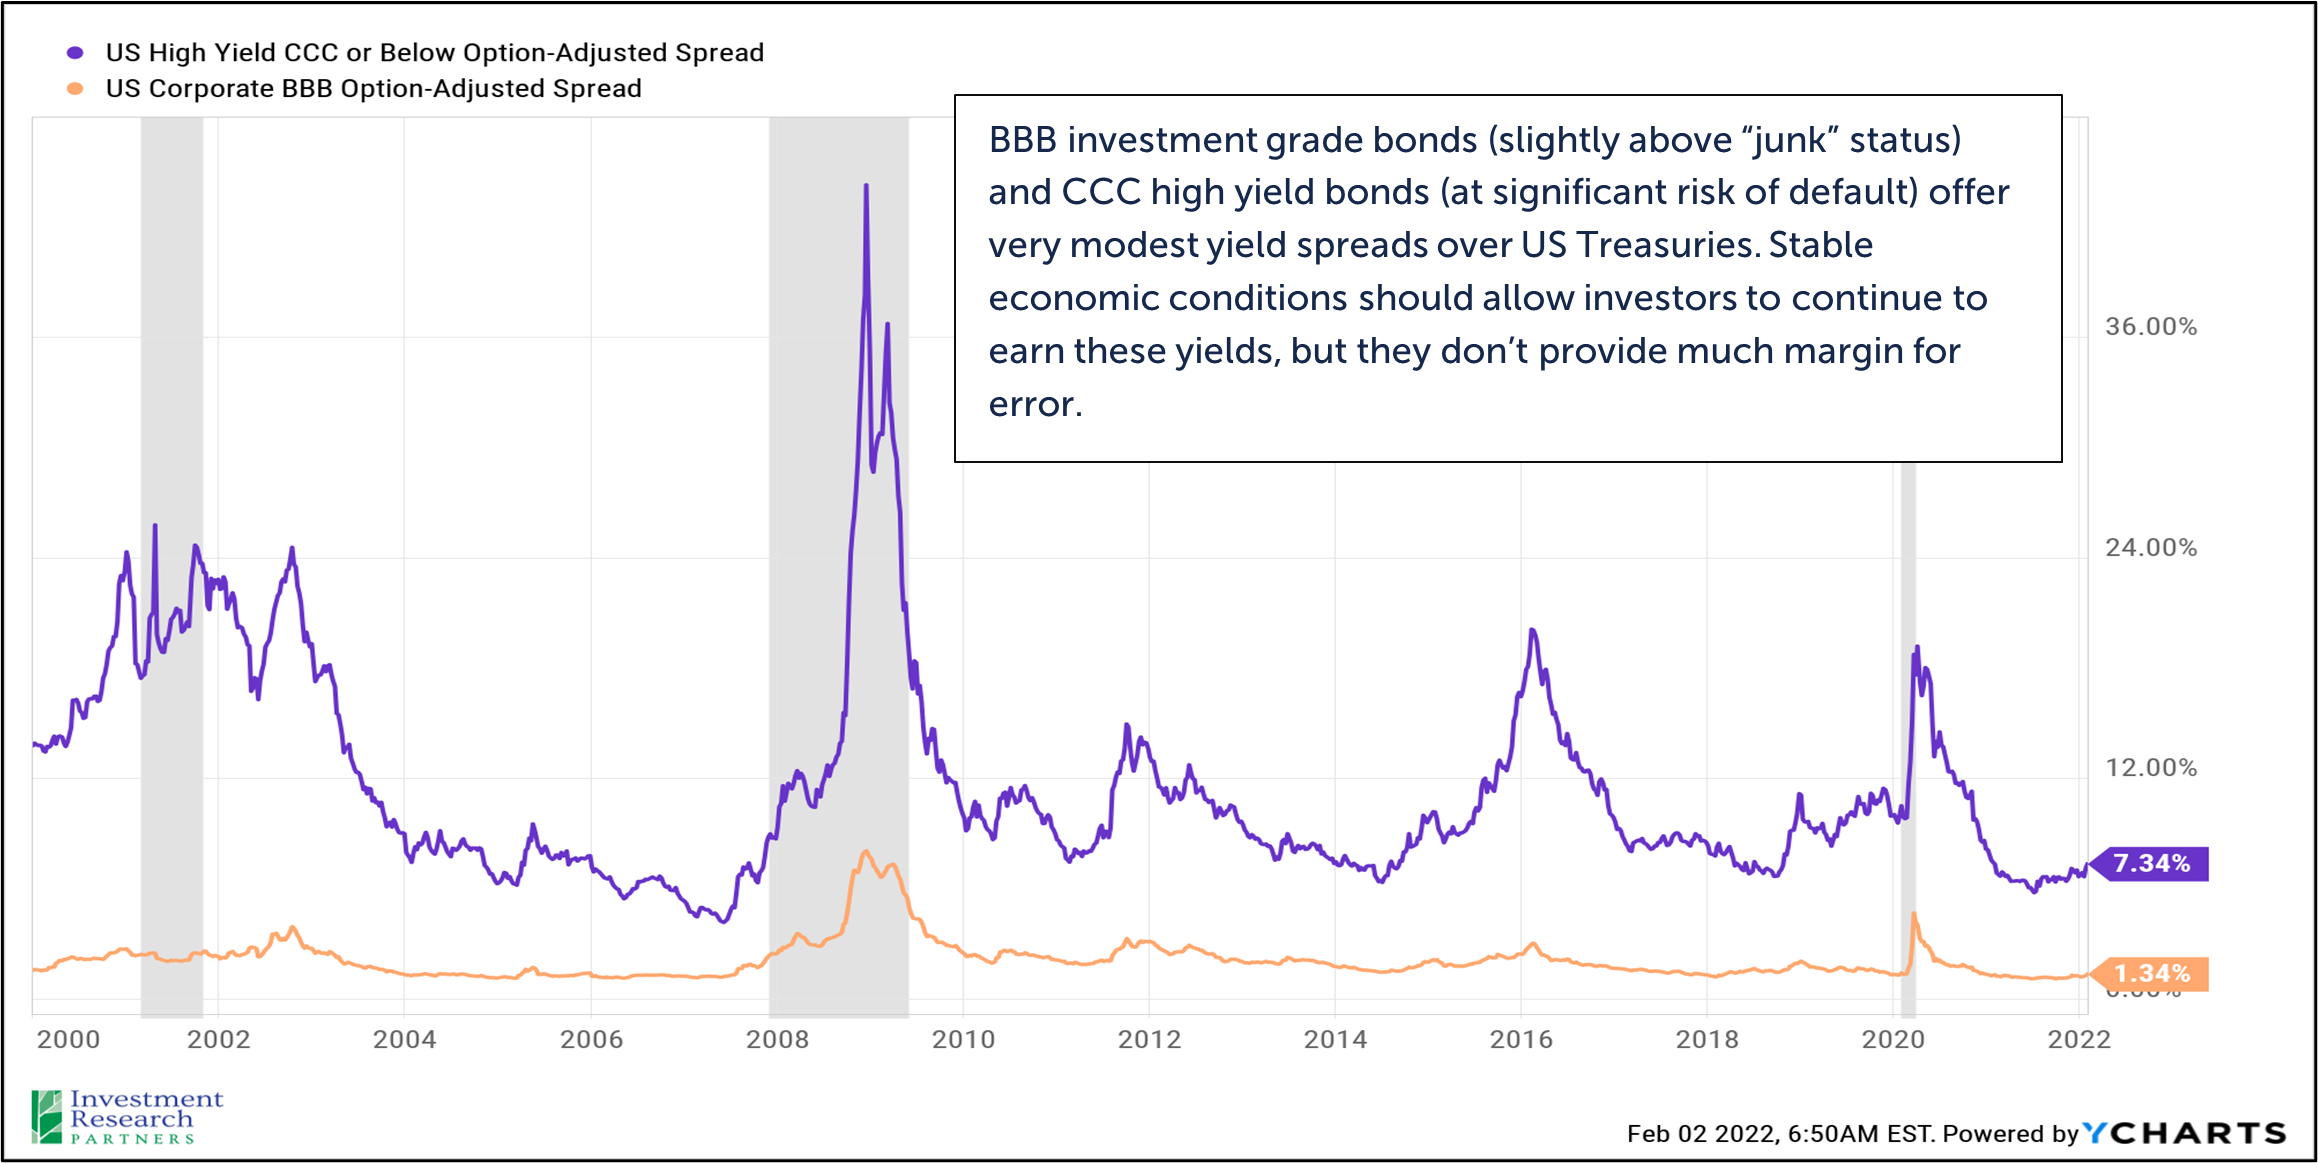
- Risk assets will reprice lower (all else equal). The base lending rate, or “Fed funds rate”, impacts how investors evaluate the fair value of a given asset. For example, a preferred stock, and the various risks associated with it, that yields 6% becomes less attractive when a risk-free asset like a short-term Treasury bill earns 1% instead of zero. The preferred stock should, all else equal, reprice lower to compensate an investor for the opportunity cost. In a more extreme example, if short-term Treasury bills earned 6% (not expected any time soon), no rational investor would ever buy the 6% preferred stock; it would have to reprice lower.
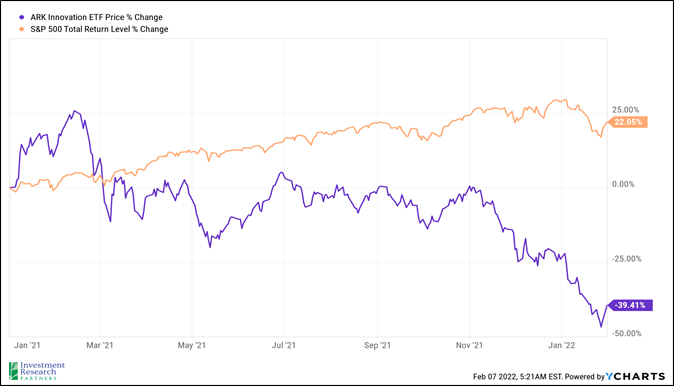
- High priced growth stocks have experienced an outsized (negative) impact from risk asset repricing. In January, this investing principle outlined in item 4. above more severely impacted companies whose cash flows are expected to occur very far in the future. For example, a company like Tesla (TSLA) earns very little profit today, just $5 per share in 2021 resulting in a 210x price-to-earnings ratio based on its year-end share price of $1,050.[1] But much of Tesla’s earnings are expected to occur long in the future, and low interest rates served to lessen the opportunity cost of waiting for future growth, allowing Tesla’s share price to rise to seemingly extreme levels. The stock was down more than 11% in January after advancing 50% in 2021 (compared to returns for the S&P 500 over these time periods of 29% and -5%, respectively). Of course, there’s more at play with any investment than just the prevailing interest rate environment, but the extreme moves of Tesla relative to the broad market in 2021 and January 2022 are emblematic of the outsized impact that interest rates can have on investments with lofty future expectations.
The Ark Innovation Fund (ARKK) rose to prominence in 2020 after the fund’s timely positioning in investments like Tesla resulted in outsized gains. Unfortunately, most of the fund’s investors never participated in those gains, as nearly $100 billion entered the fund in late 2020 and early 2021, just before performance peaked.[2]
The research that follows seeks to outline exactly why we remain optimistic for economic growth in 2022, and why it could be an exciting year to invest. Thank you for your continued confidence in our management of your wealth.
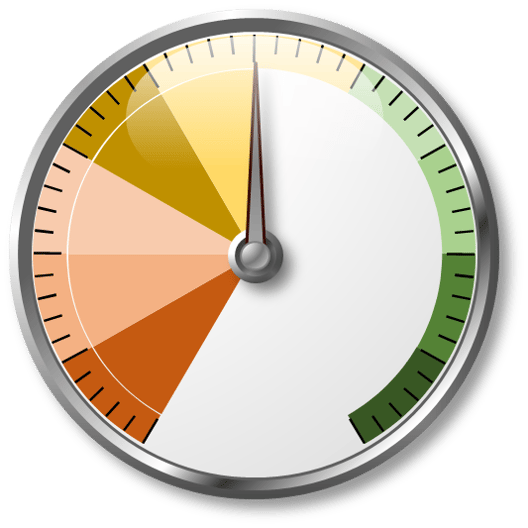
Overall Risk-Taking Score
 |
|
The Risk-Taking Score (RTS) should be utilized relative to your long-term strategic asset allocation selected by you and your financial advisor. The RTS is meant to be illustrative of our Investment Committee’s view toward the overall investing environment in the short-to-intermediate term (0-3 years) and how your portfolio should be positioned accordingly relative to your long-term strategic allocation.
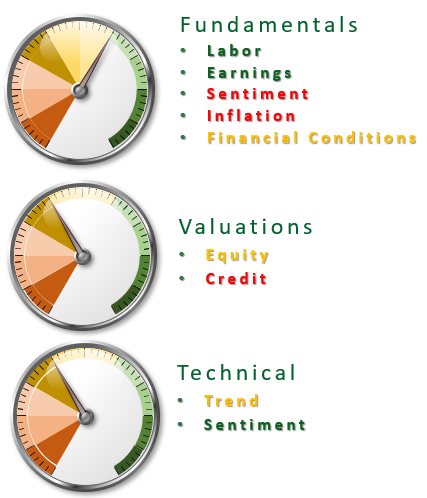
Risk-Taking Score Subcomponents
 |
|
Economy
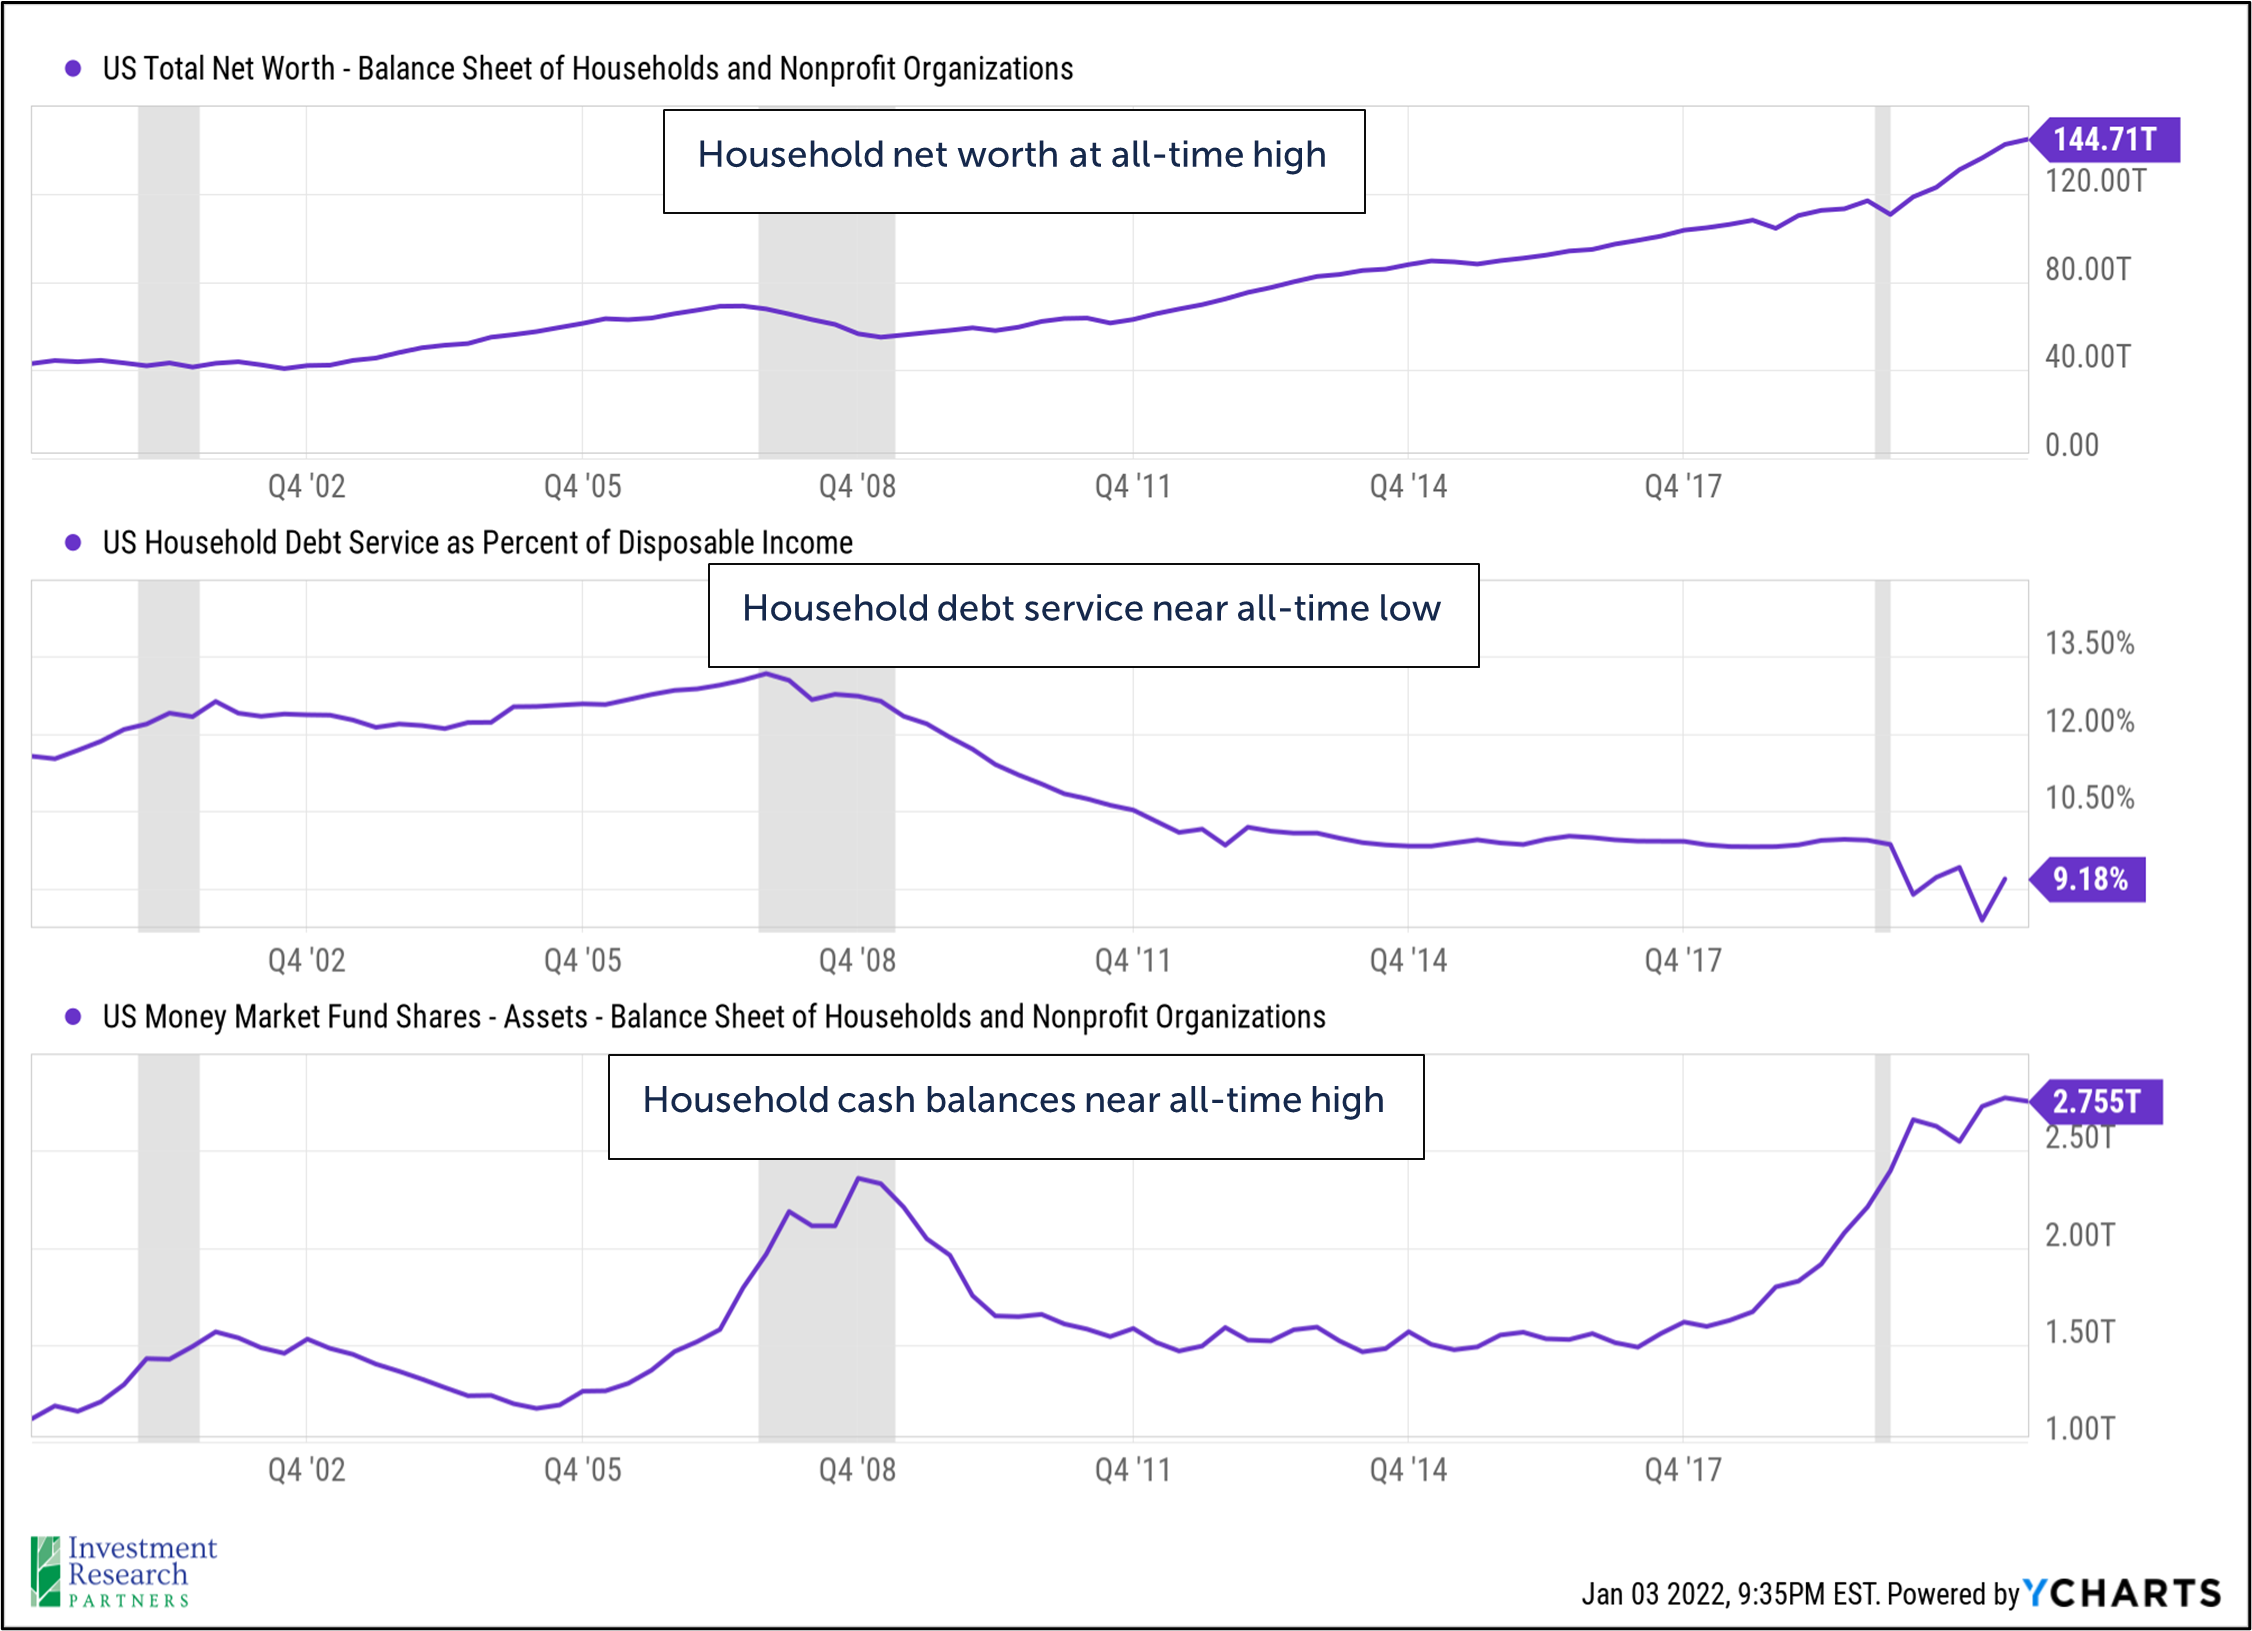
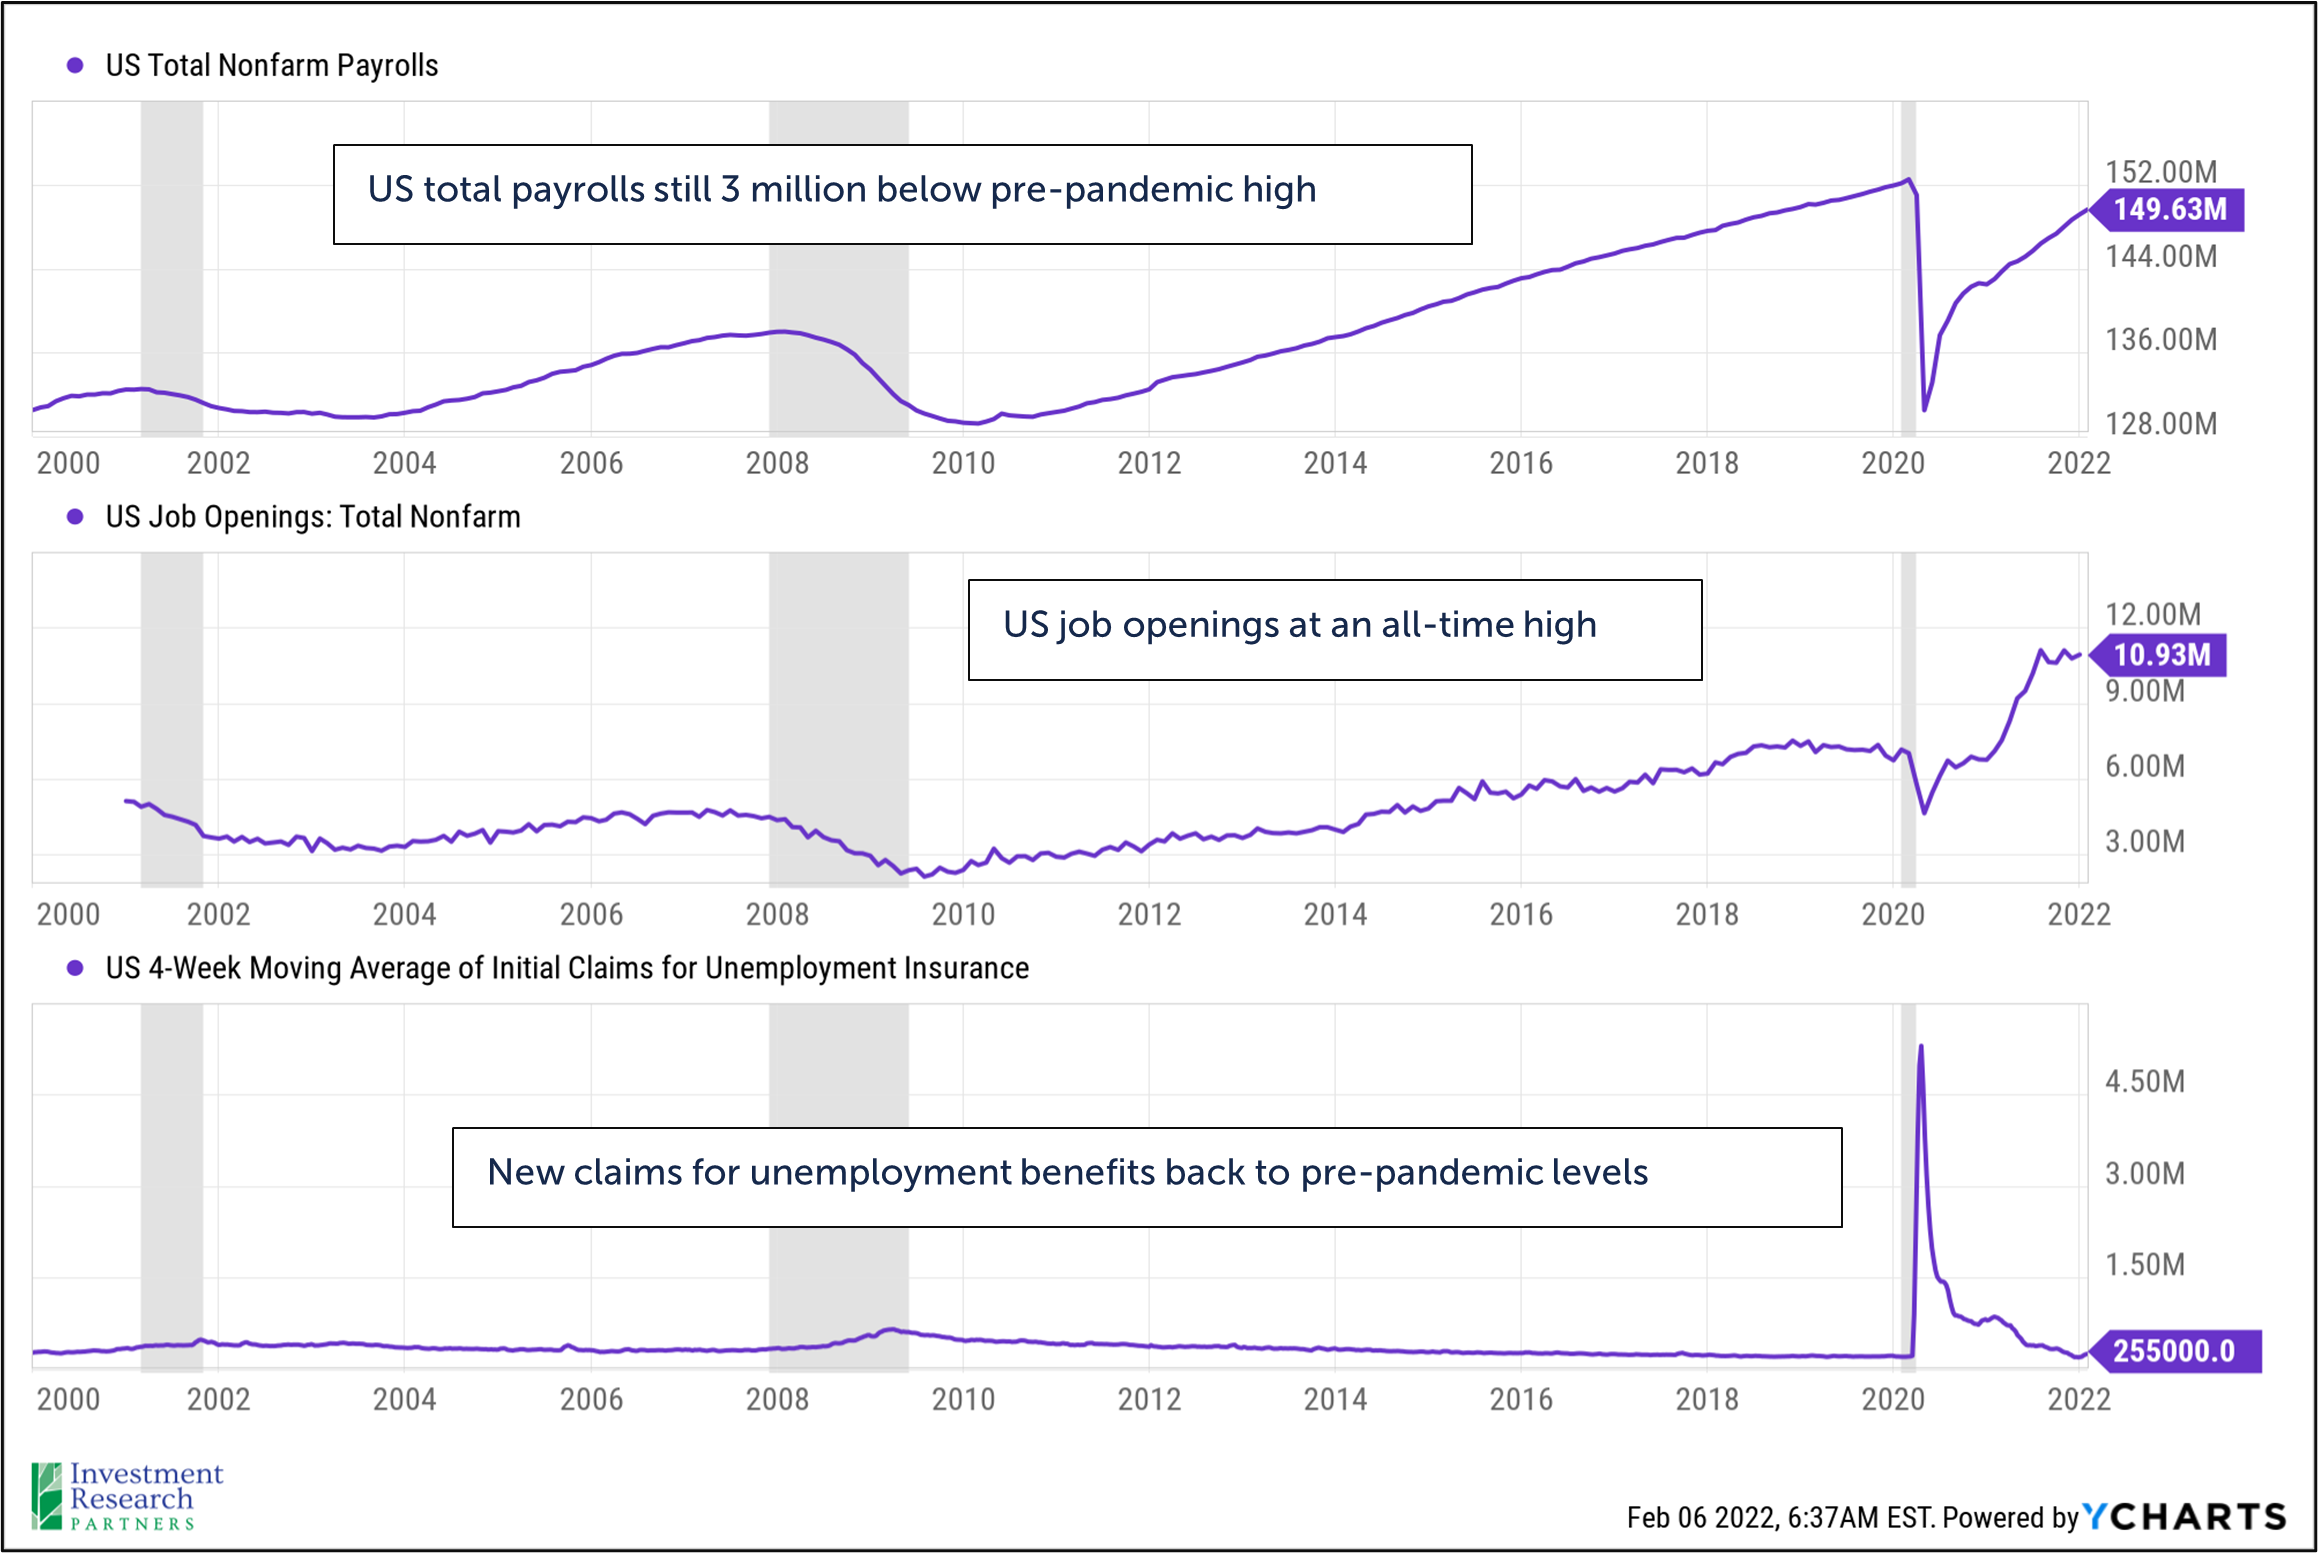
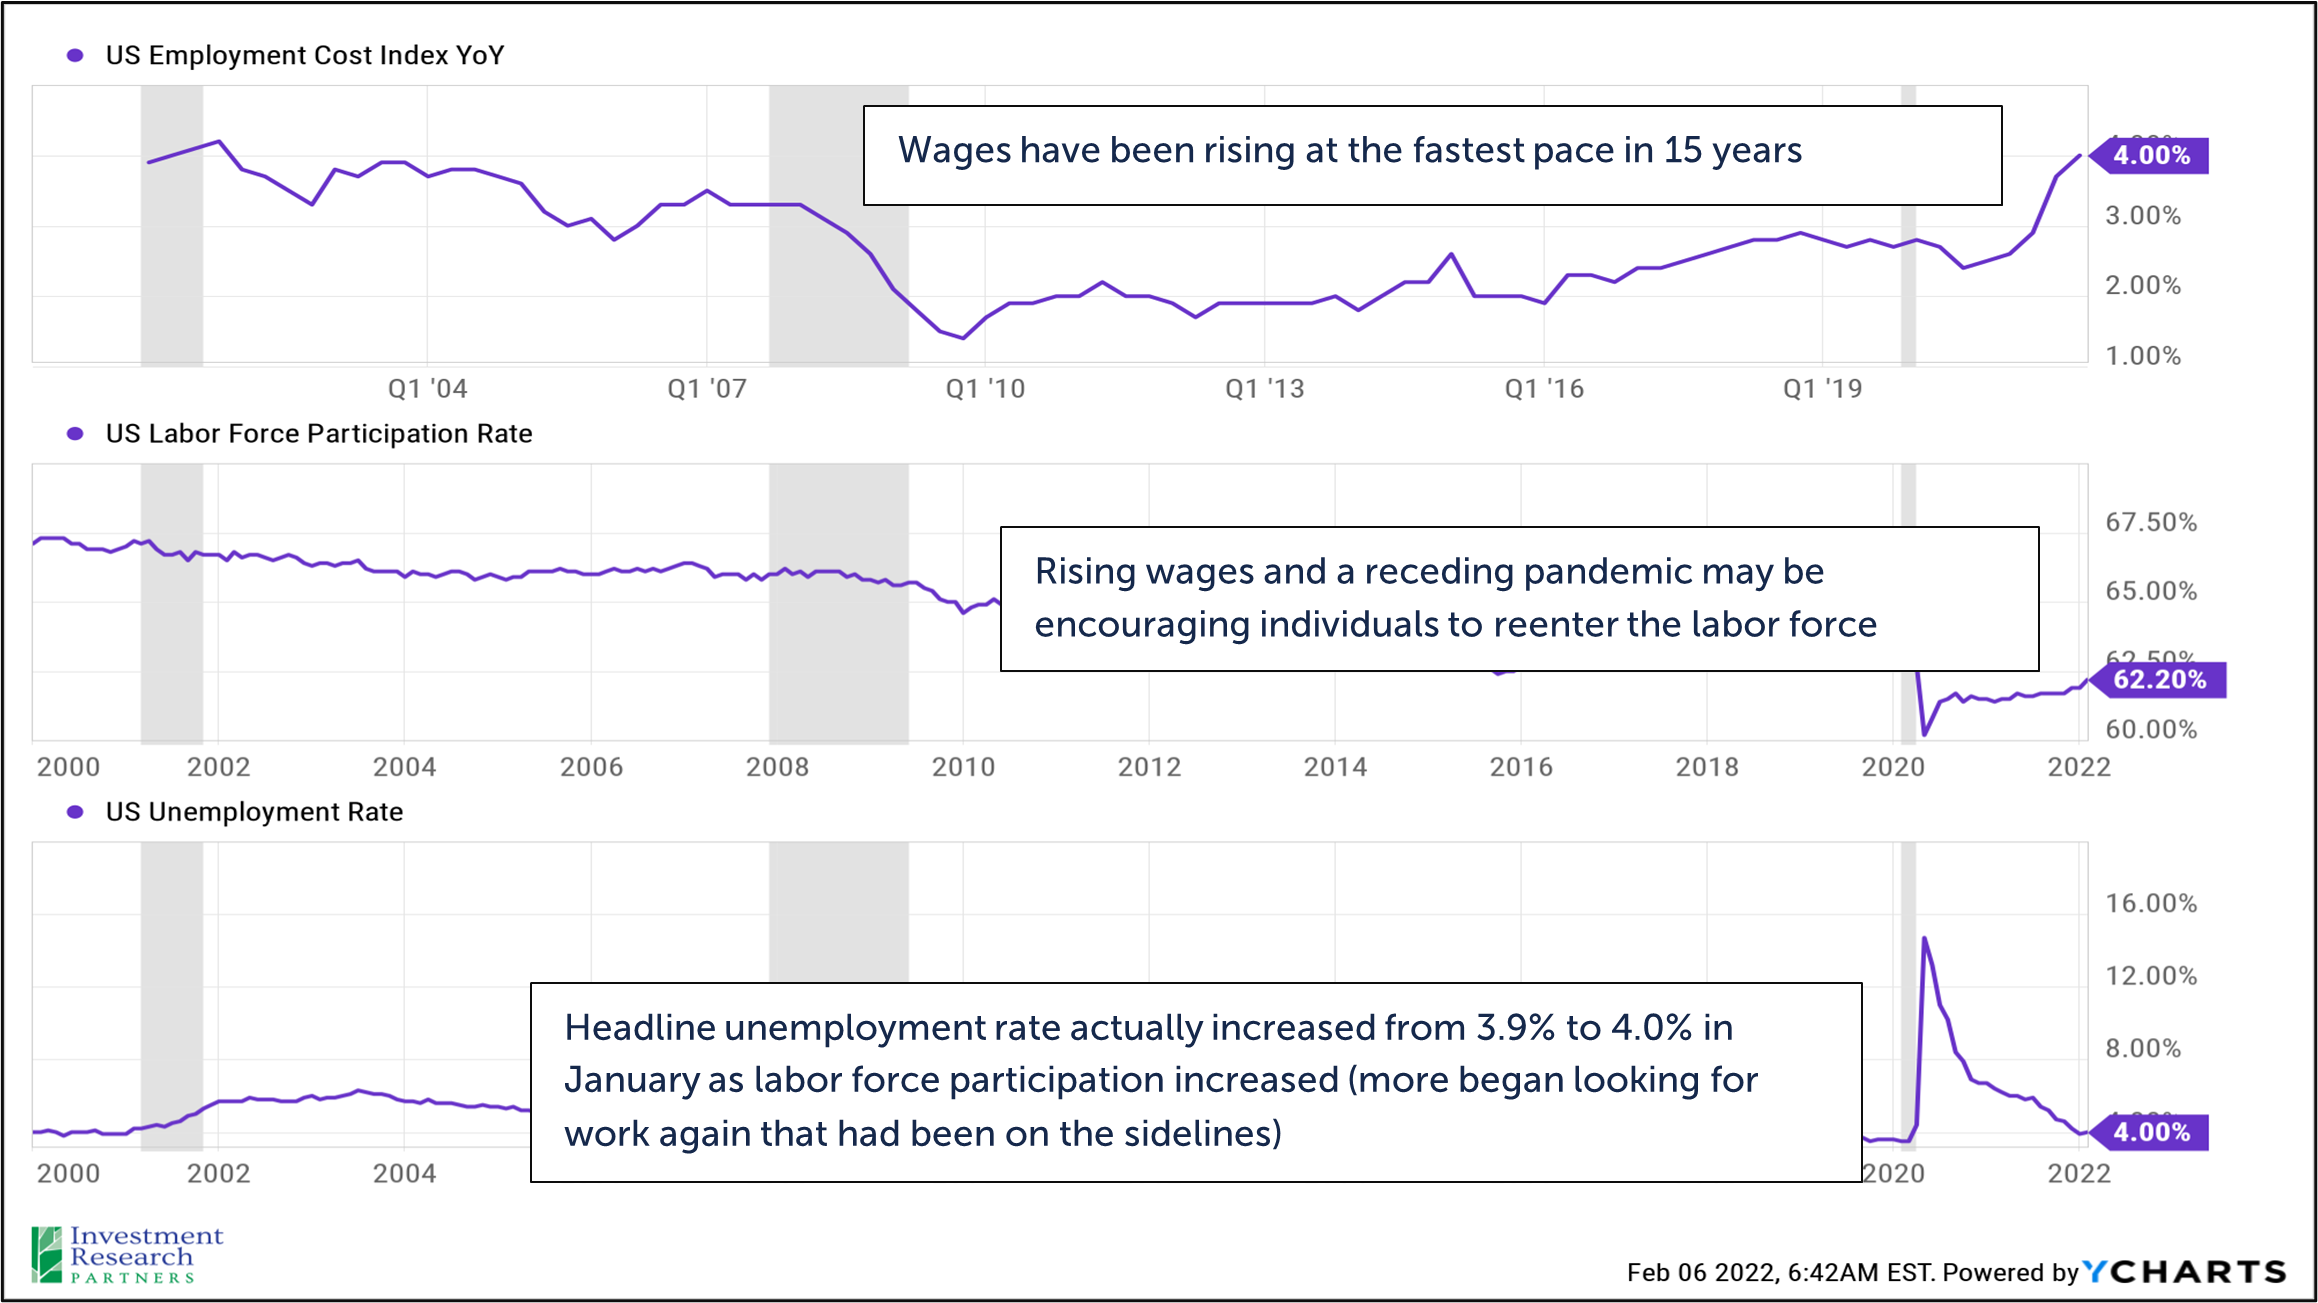
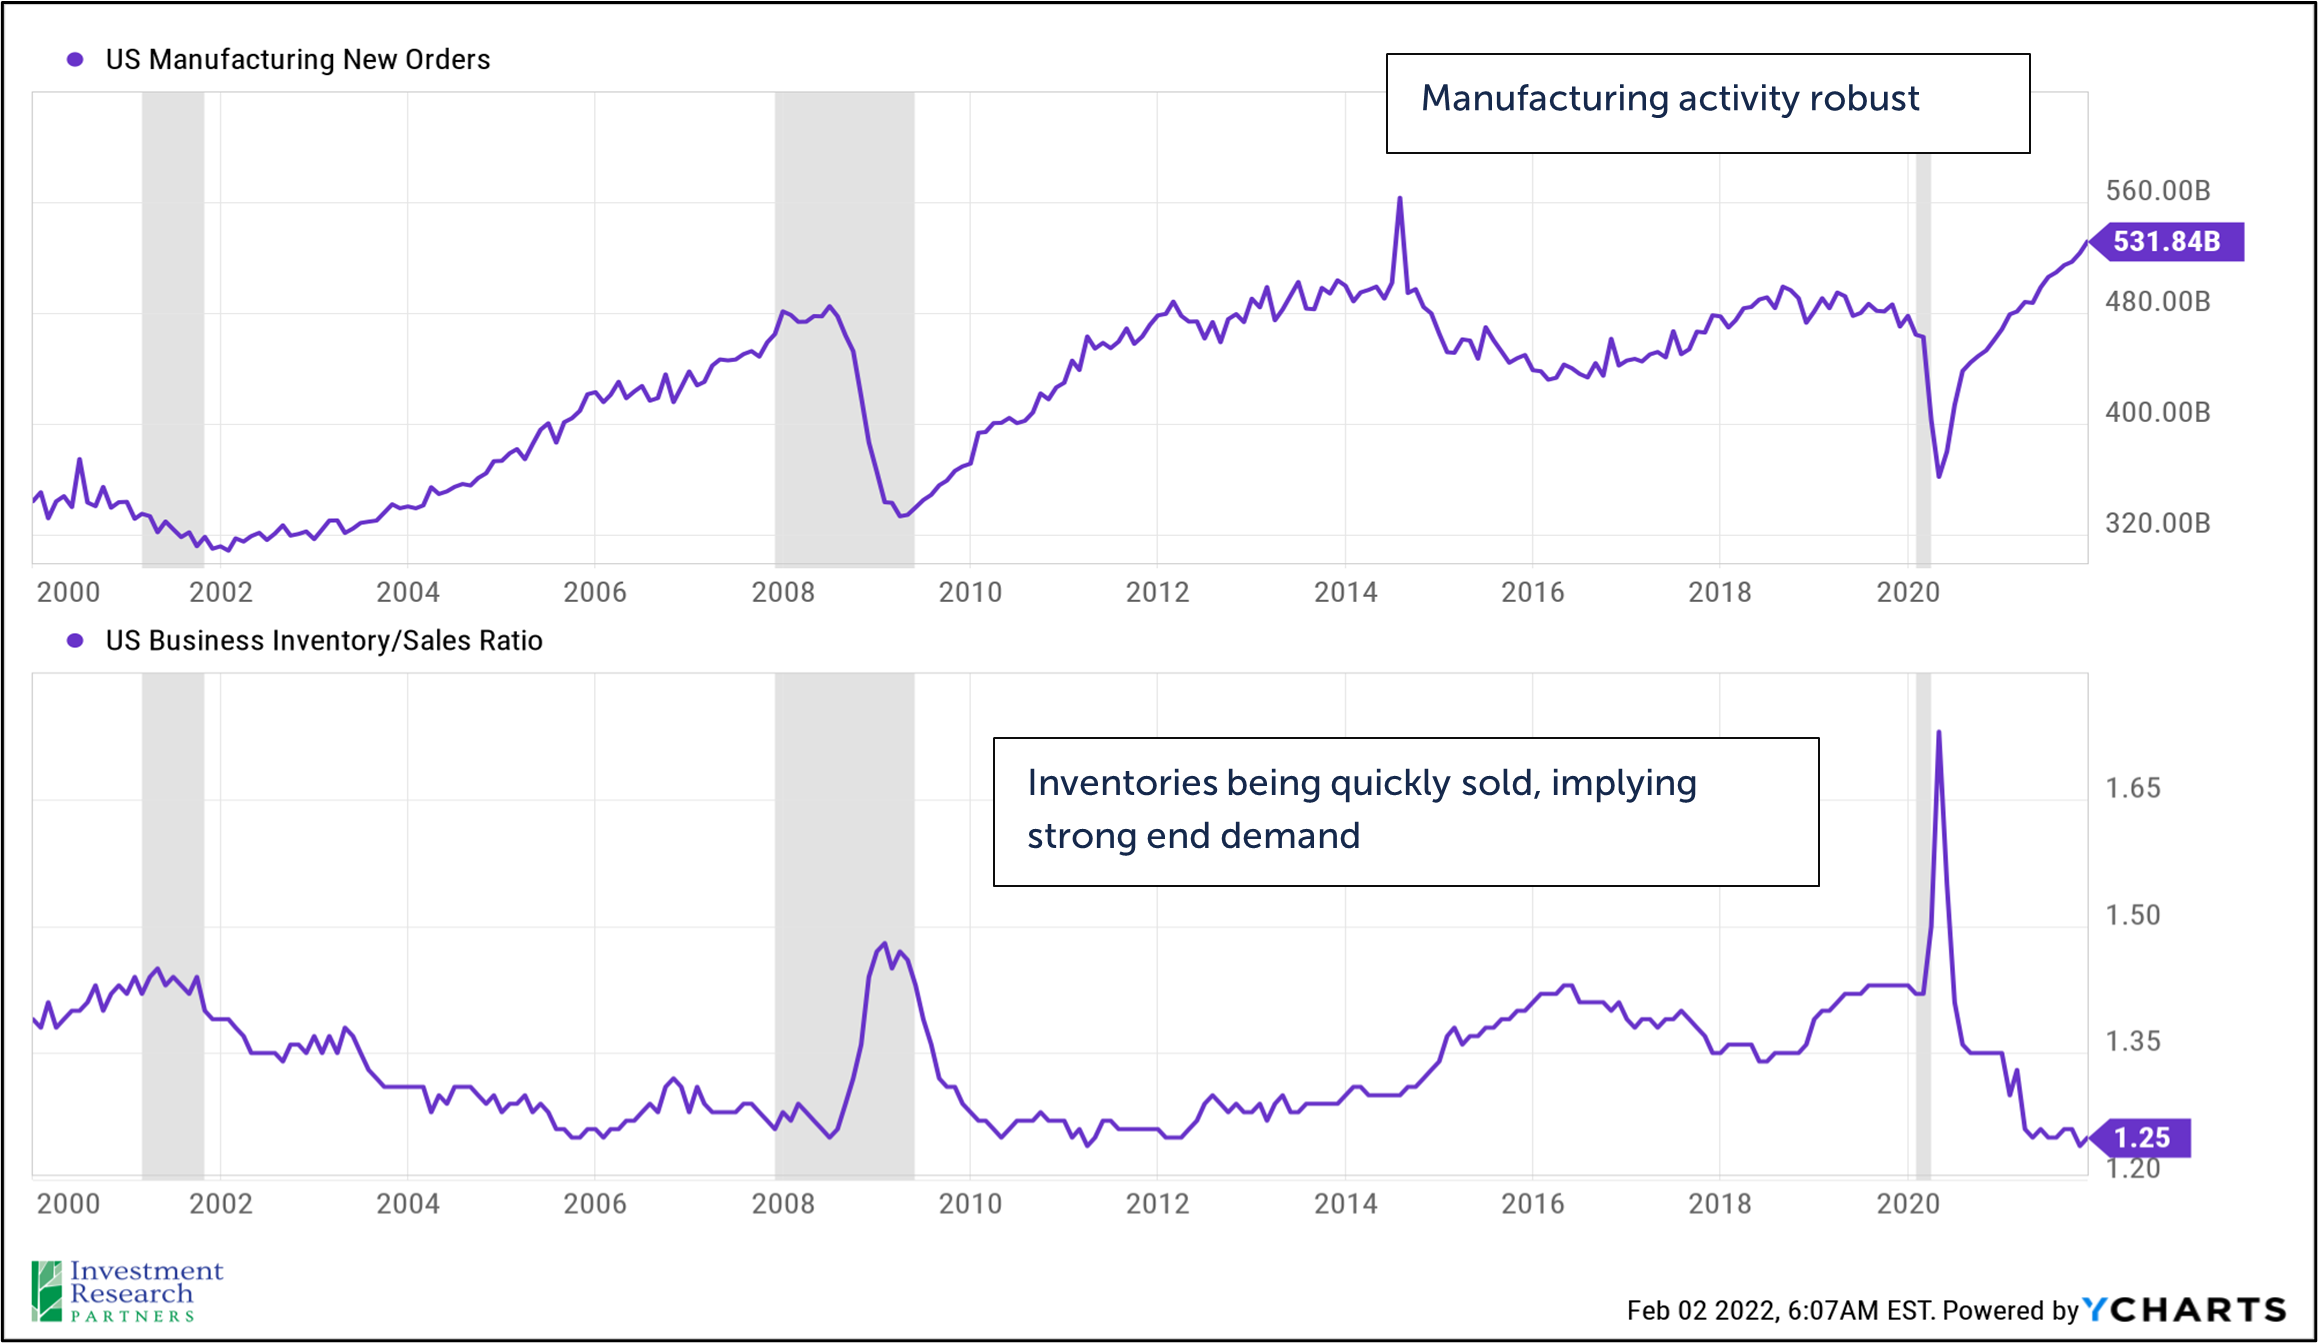
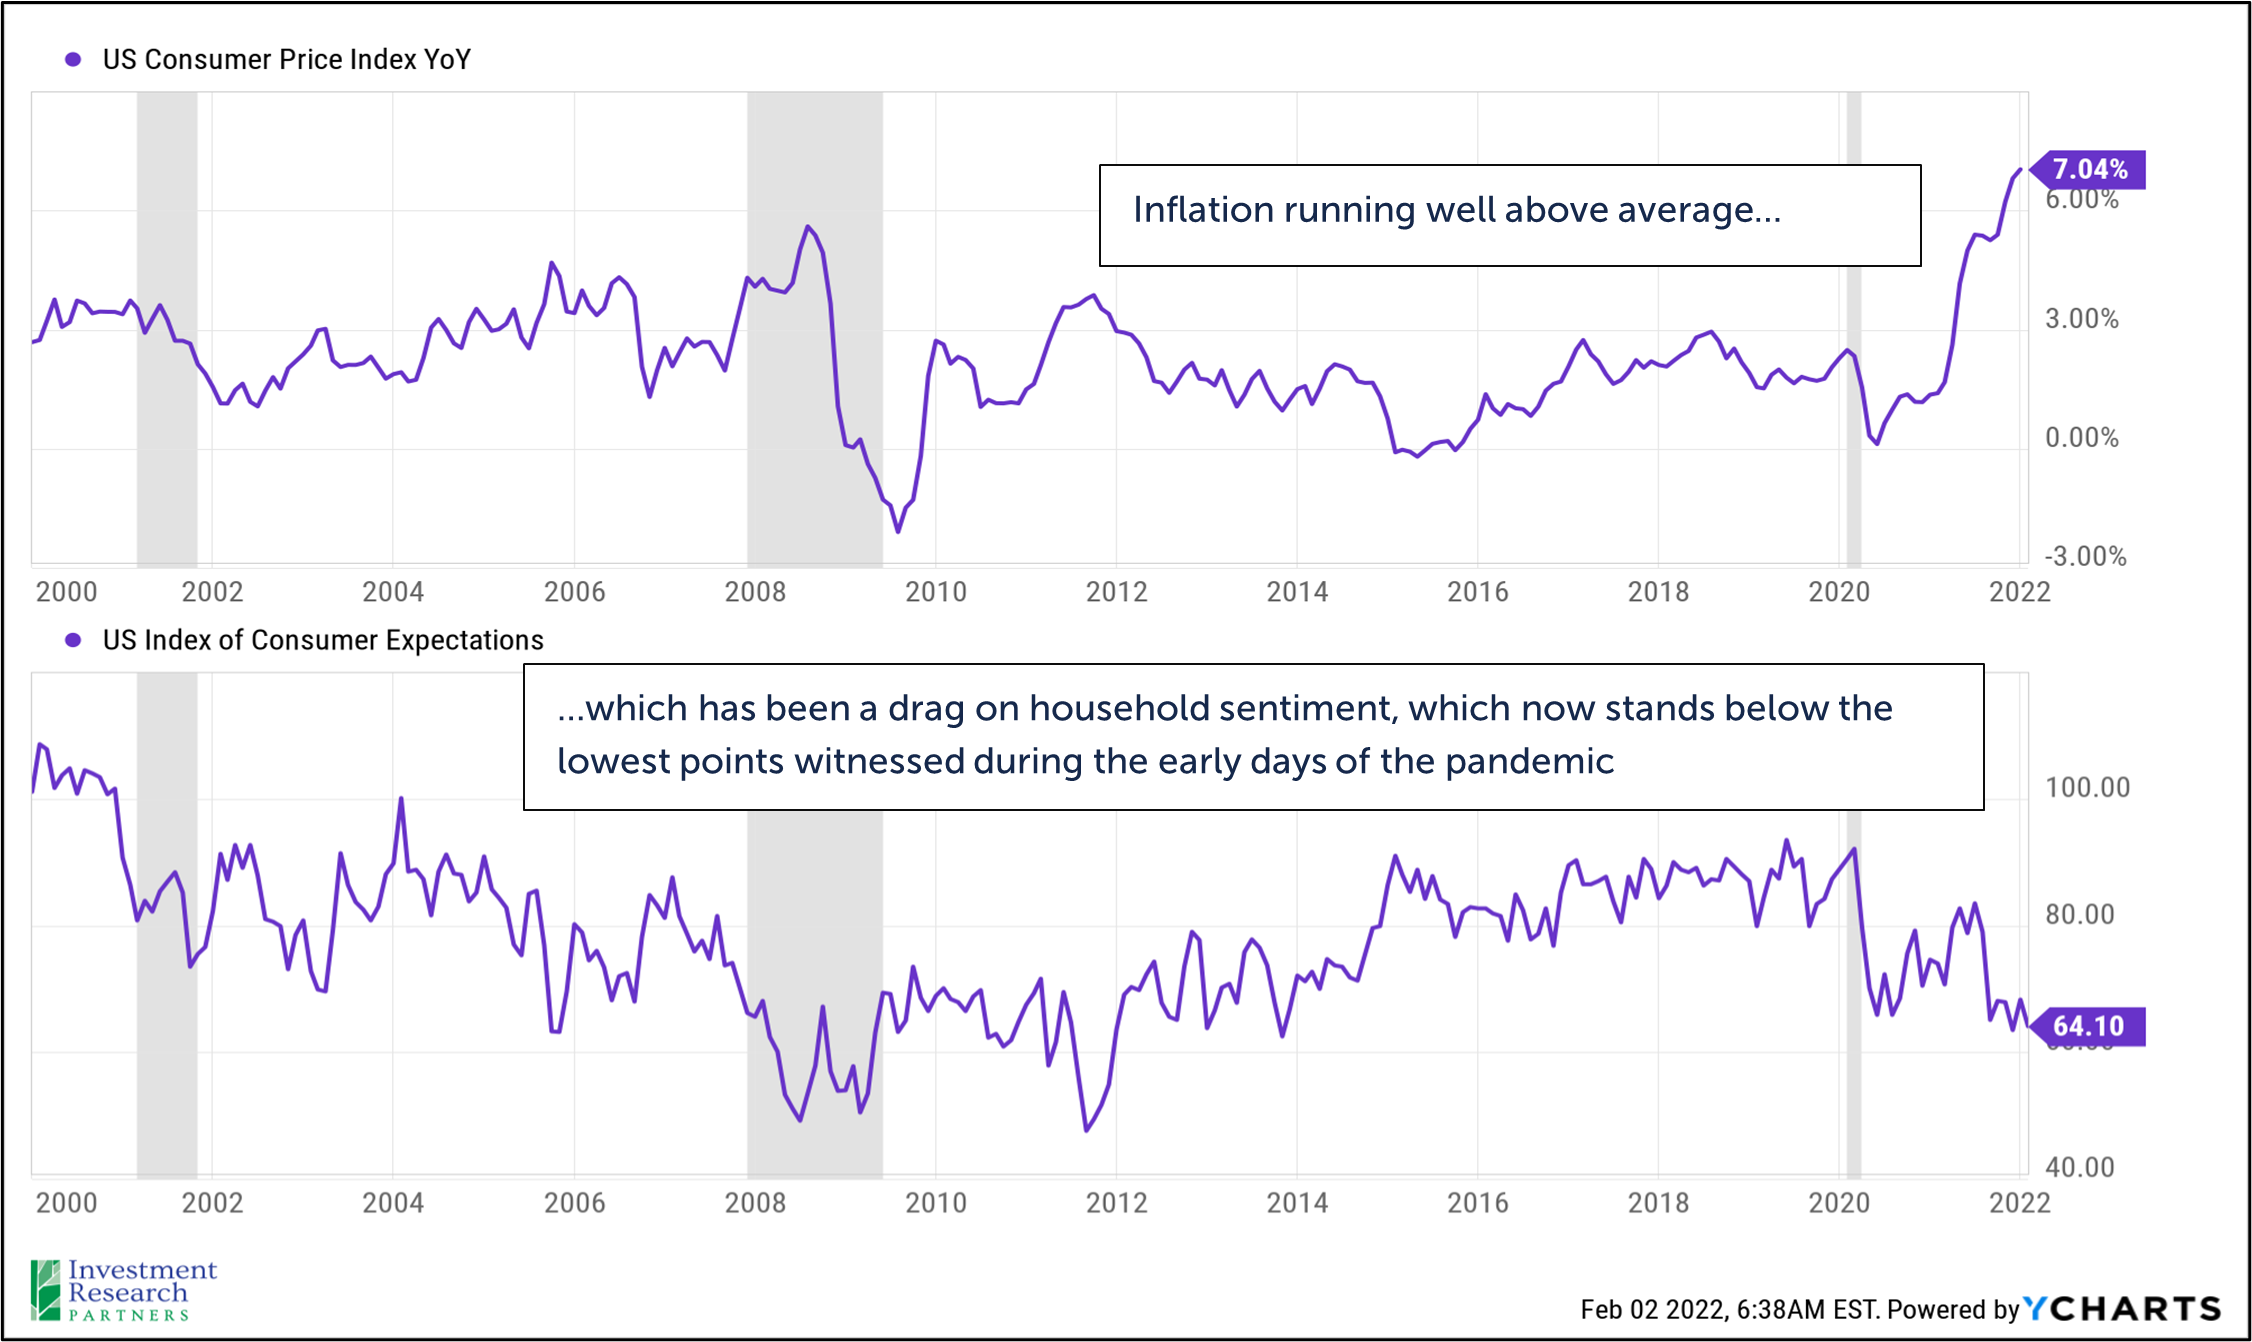
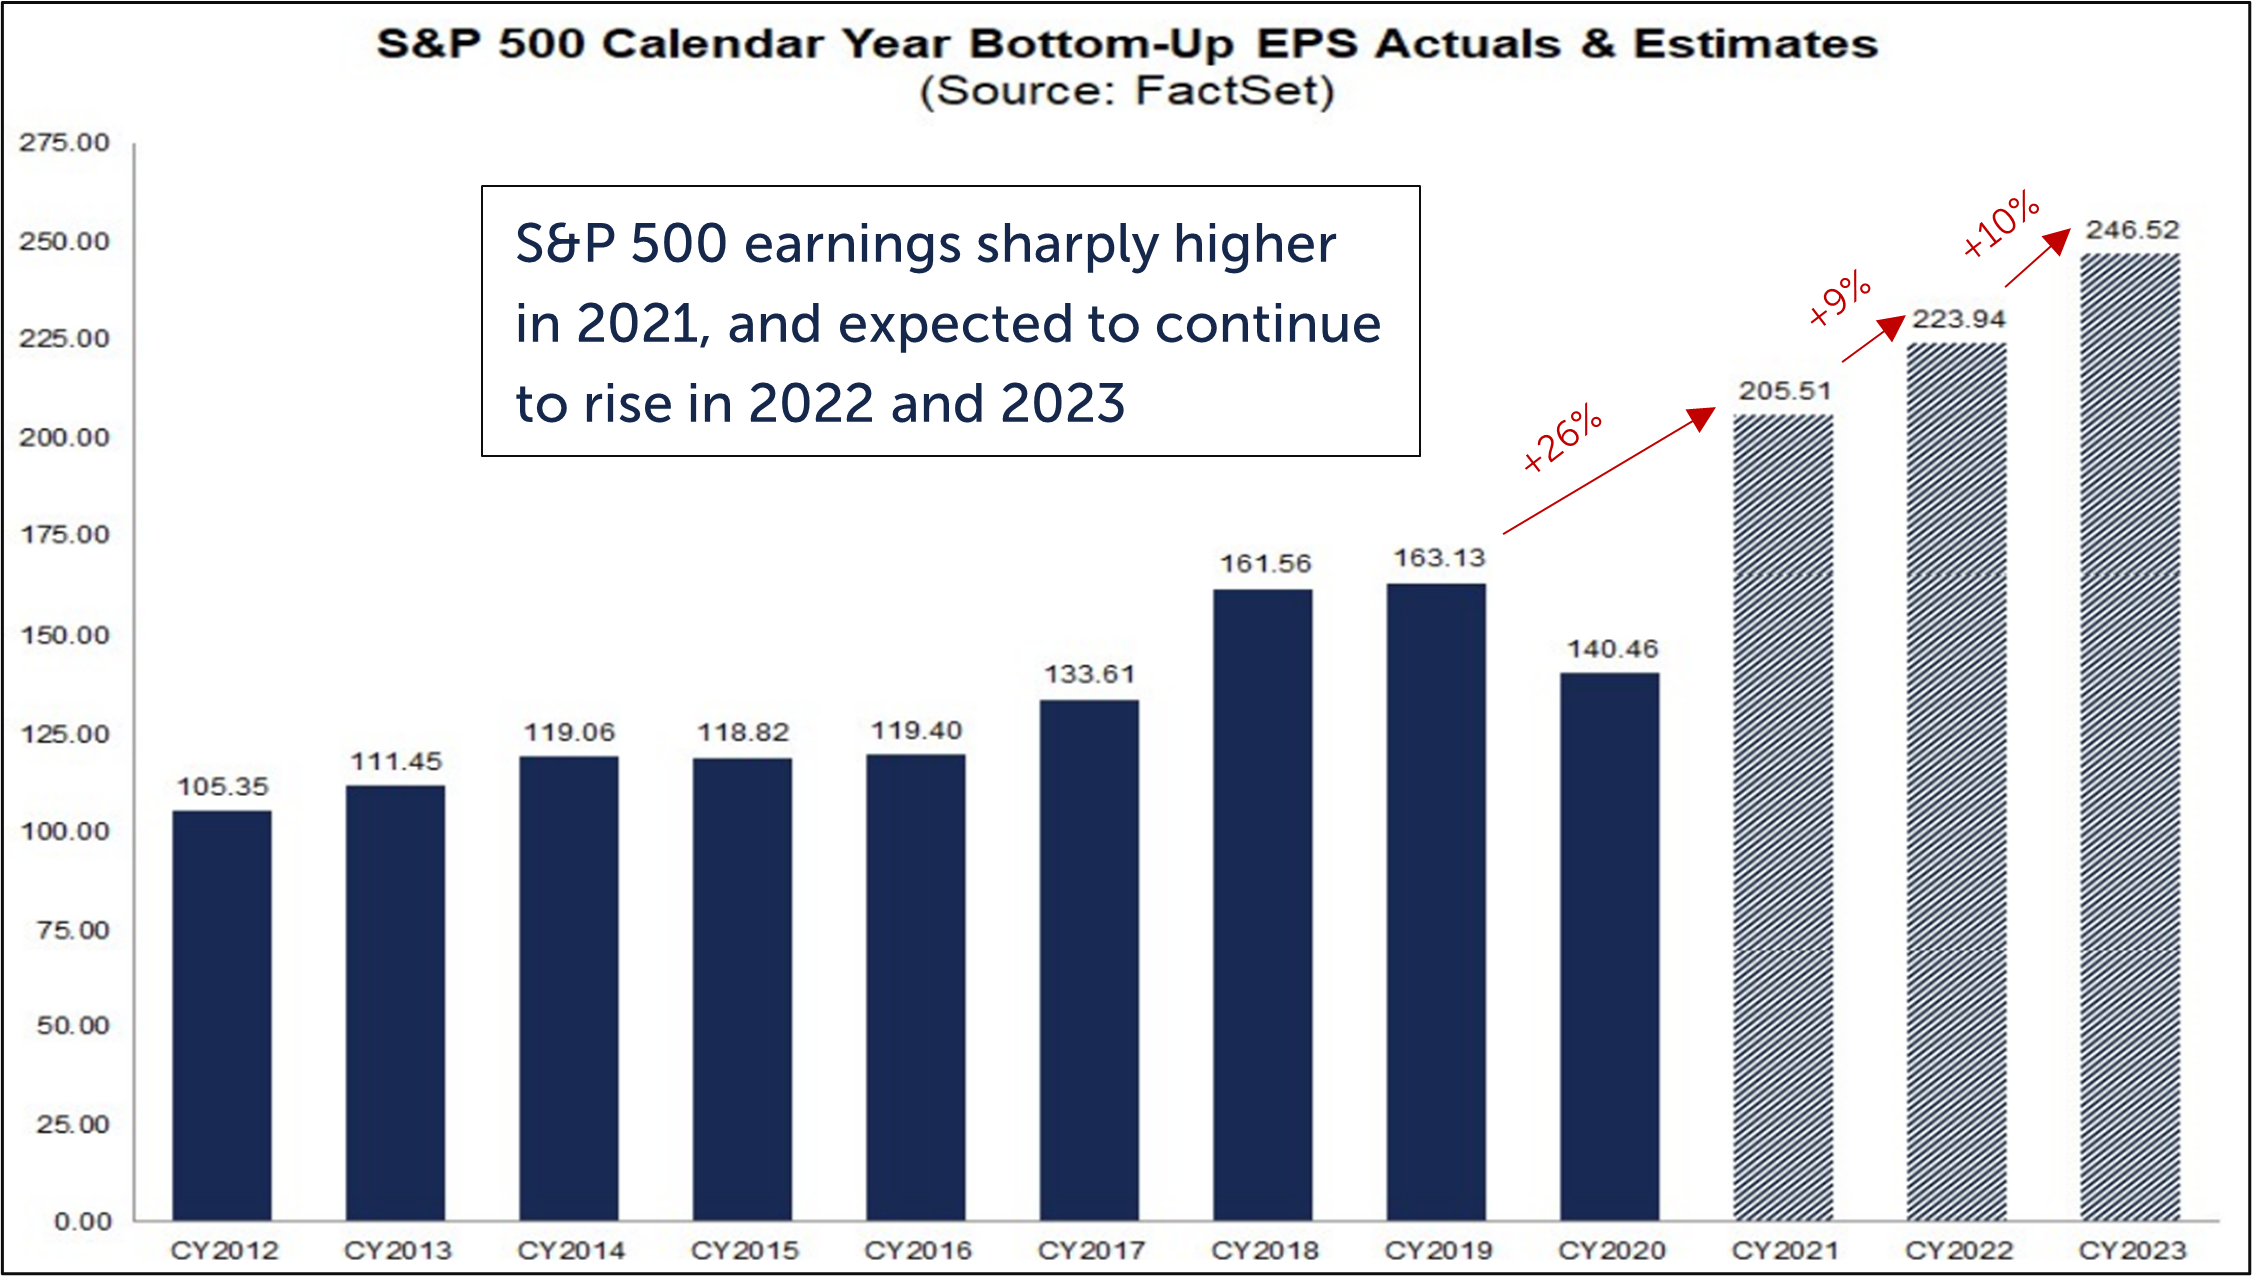
US economic growth remains in an upward trajectory. Inflation and supply chain-related issues continue to receive media attention, but these issues are largely driven by very robust demand for goods and services. Much of this demand is being driven by households which, on average, are in the best financial position in decades as a result of fiscal stimulus and low interest rates. Labor markets have been improving rapidly, with the unemployment rate dropping to 4.0% in January as 467,000 net new jobs were added. US manufacturing new orders are robust, and we have not yet seen evidence of a concerning build-up in inventories that has predicated past recessions. However, the sharp rise in inflation which began in summer 2021 coincided with a swift reversal of household sentiment as those surveyed responded with concerns that higher prices would erode their standard of living. We expect the rate of inflation to peak and trend toward more normal levels in 2022 as the pandemic recedes, fiscal and monetary stimulus are pared back, and energy prices stabilize.
As of February 4, 56% of S&P 500 companies had reported Q4 2021 results. More than three-quarters of those companies outperformed analysts’ consensus expectations for revenue and profit, though increasingly companies like Netflix and Peloton have mentioned slowing expectations in the quarters ahead, and firms like Goldman Sachs have cited significant increases in their compensation costs. All of which have contributed to increased market volatility in January.
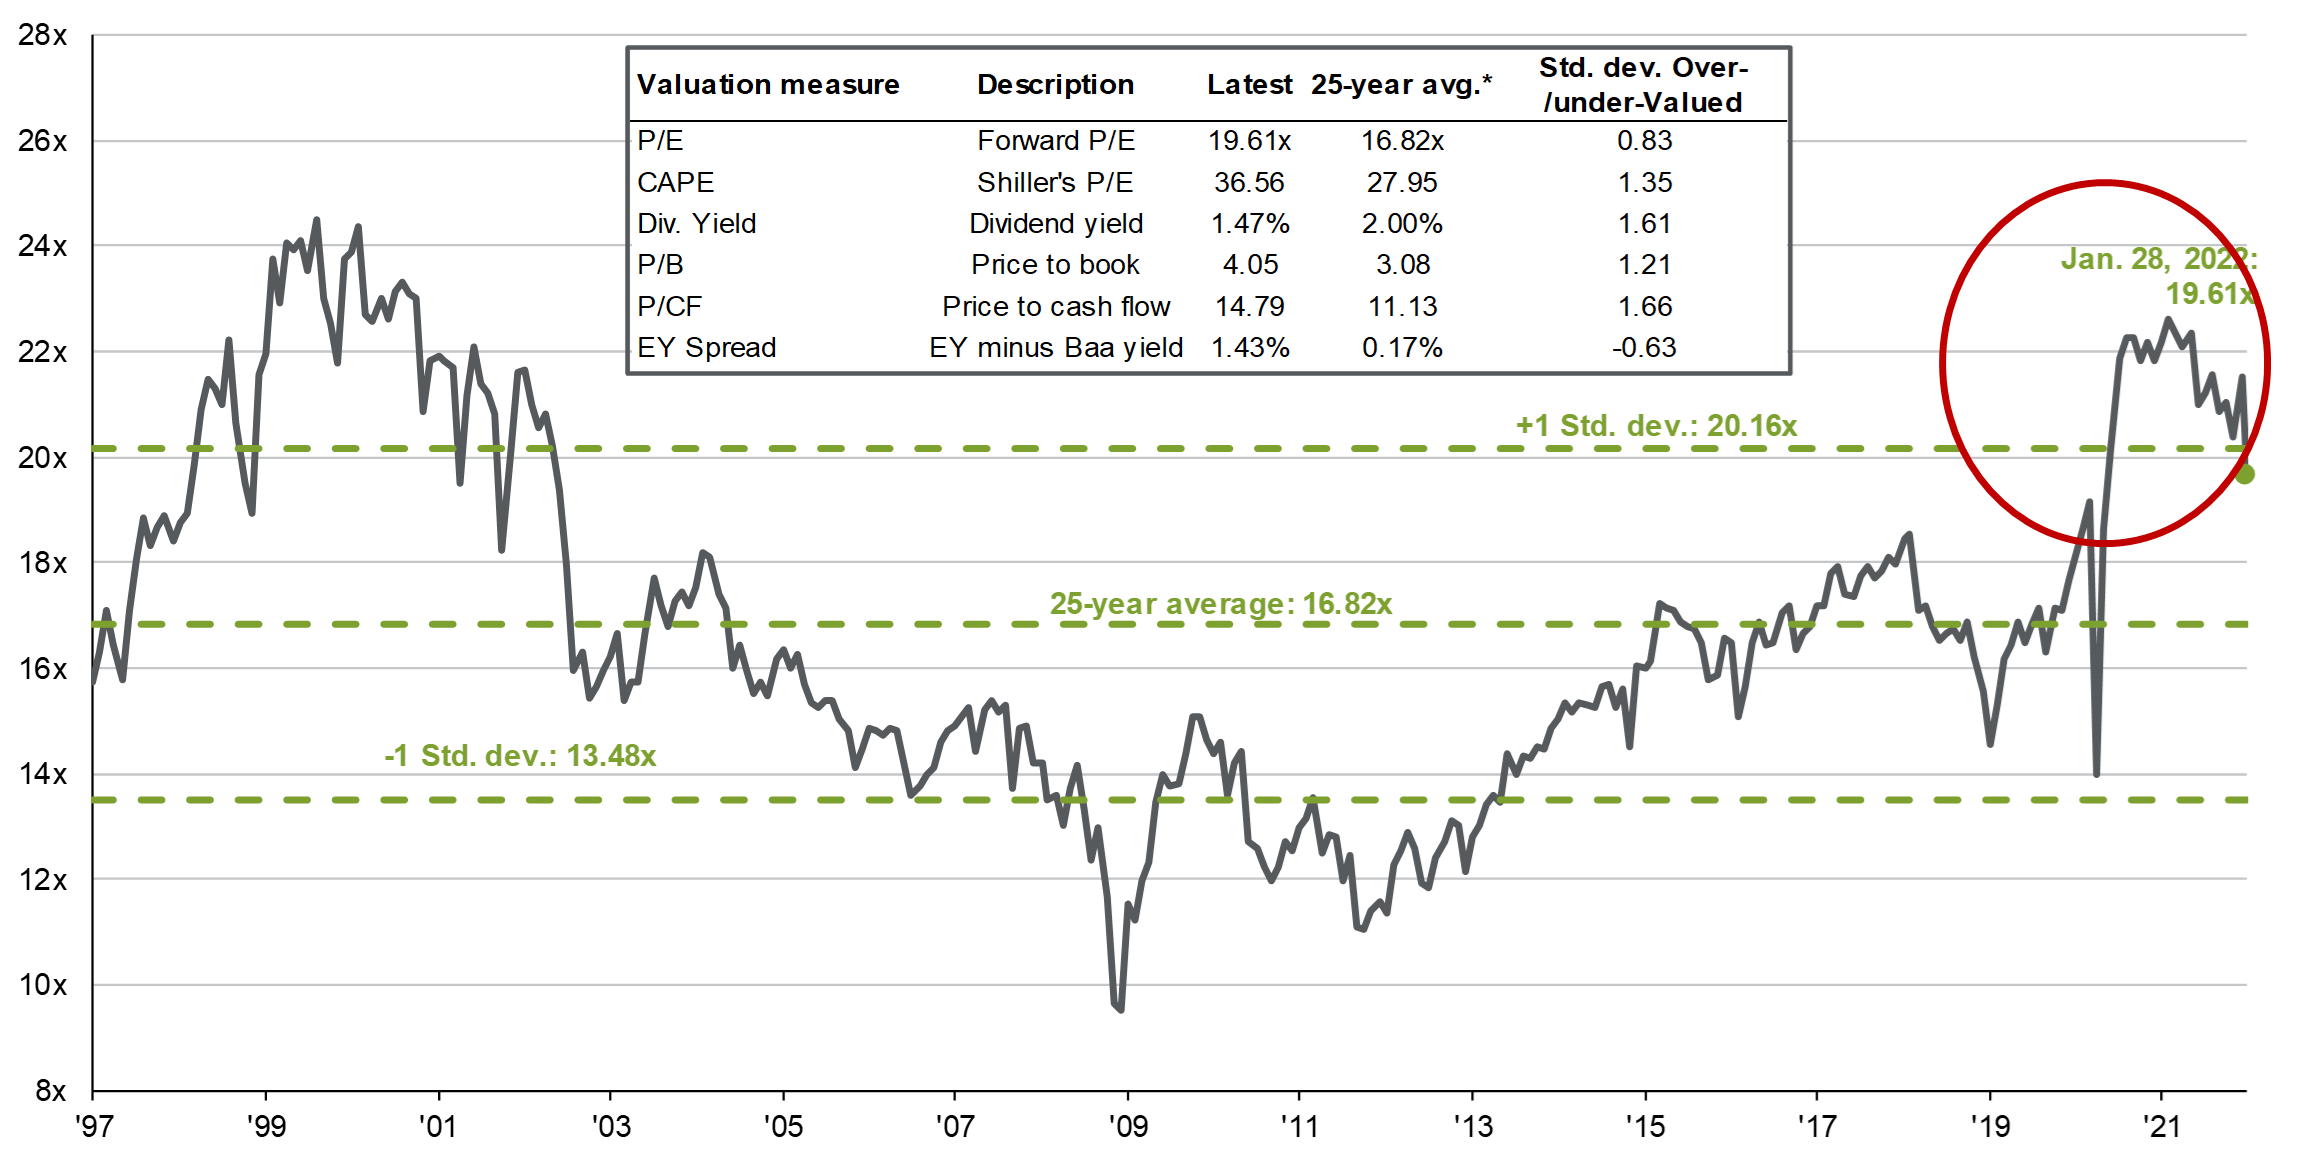
Valuation
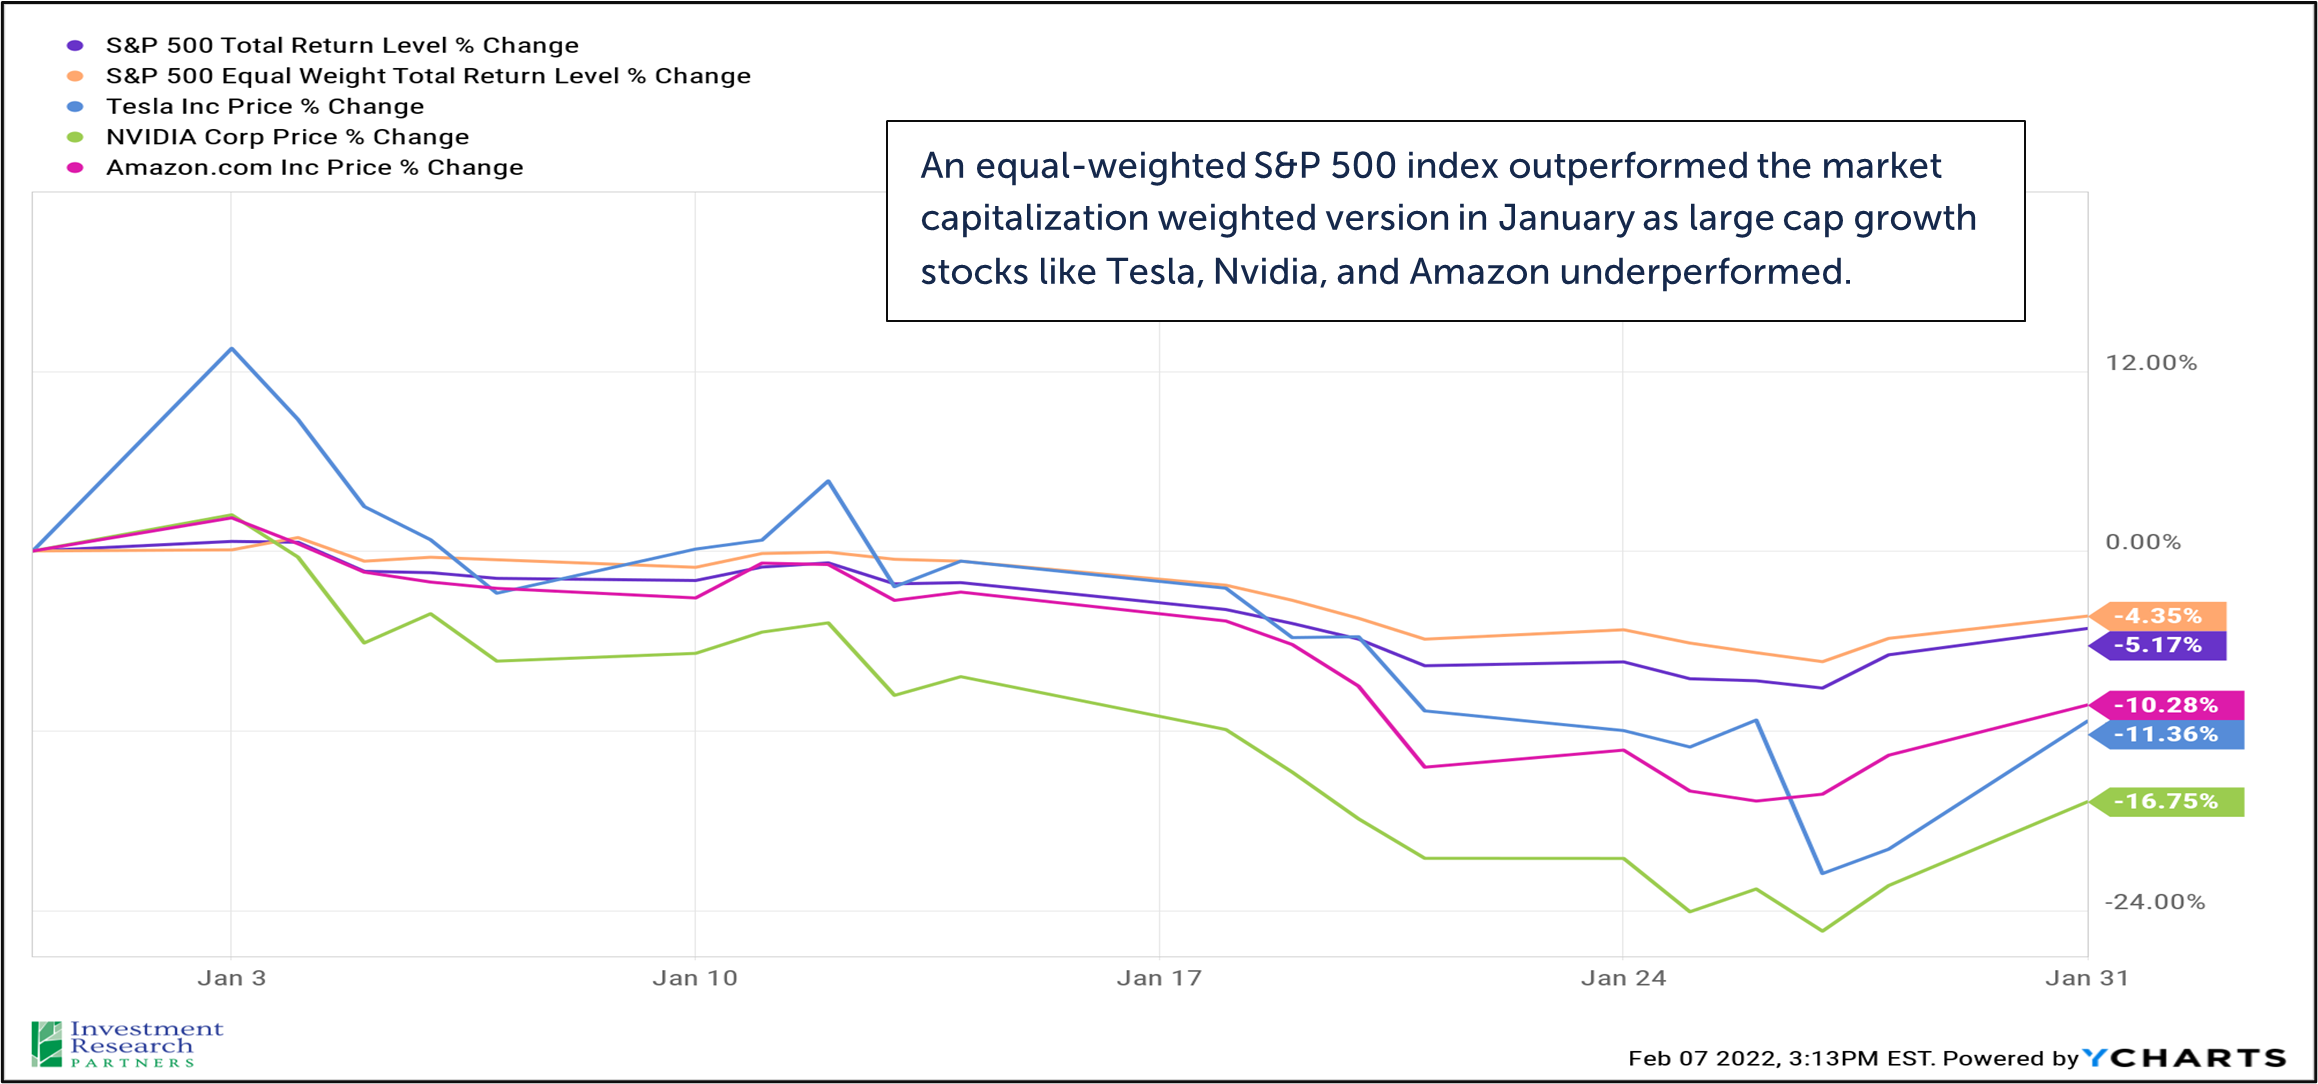
When assessing stock market valuation, investors often first look to the S&P 500 index as a gauge. The combination of earnings growth and share price declines in January have served to push the index’s price-to-earnings ratio down toward a more historically normal range. In last month’s letter, we highlighted the significant concentration of the S&P 500’s top holdings in large cap growth stocks, which saw outsized declines in January. This led to the S&P 500 underperforming an equally-weighted index during the month.
S&P Price-to-Expected Earnings
Technical
Our technical analysis of markets involves multiple tools that seek to identify buy / sell signals and trends across various asset classes and securities. In January, many parts of the market that had been in strong upward trends for nearly two years, such as technology stocks, broke down. We are now looking for signs of a “bottoming process”, which simply means that selling is no longer overwhelming buying of a particular asset or asset class, and a new uptrend may be emerging.
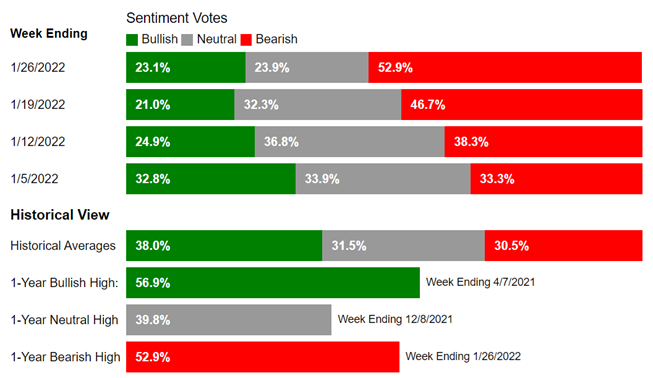
Since 1987, The American Association of Individual Investors (AAII) has been asking its members the same question every week: “What direction will the stock market be in the next six months?” The results are compiled into bulls, neutral, and bears. The bearish responses rose sharply in January. Interestingly, when the survey has shown extreme imbalances (both extreme bearishness and extreme bullishness), this has historically often indicated a contrarian signal. Today’s extreme bearishness among survey members may be presenting a contrarian buying signal.
Implications for Portfolio Management
There are two primary considerations influencing our portfolio management approach going into 2022:
- Federal Reserve policy and investors' expectations for it.
- Dispersion of stock prices in the market.
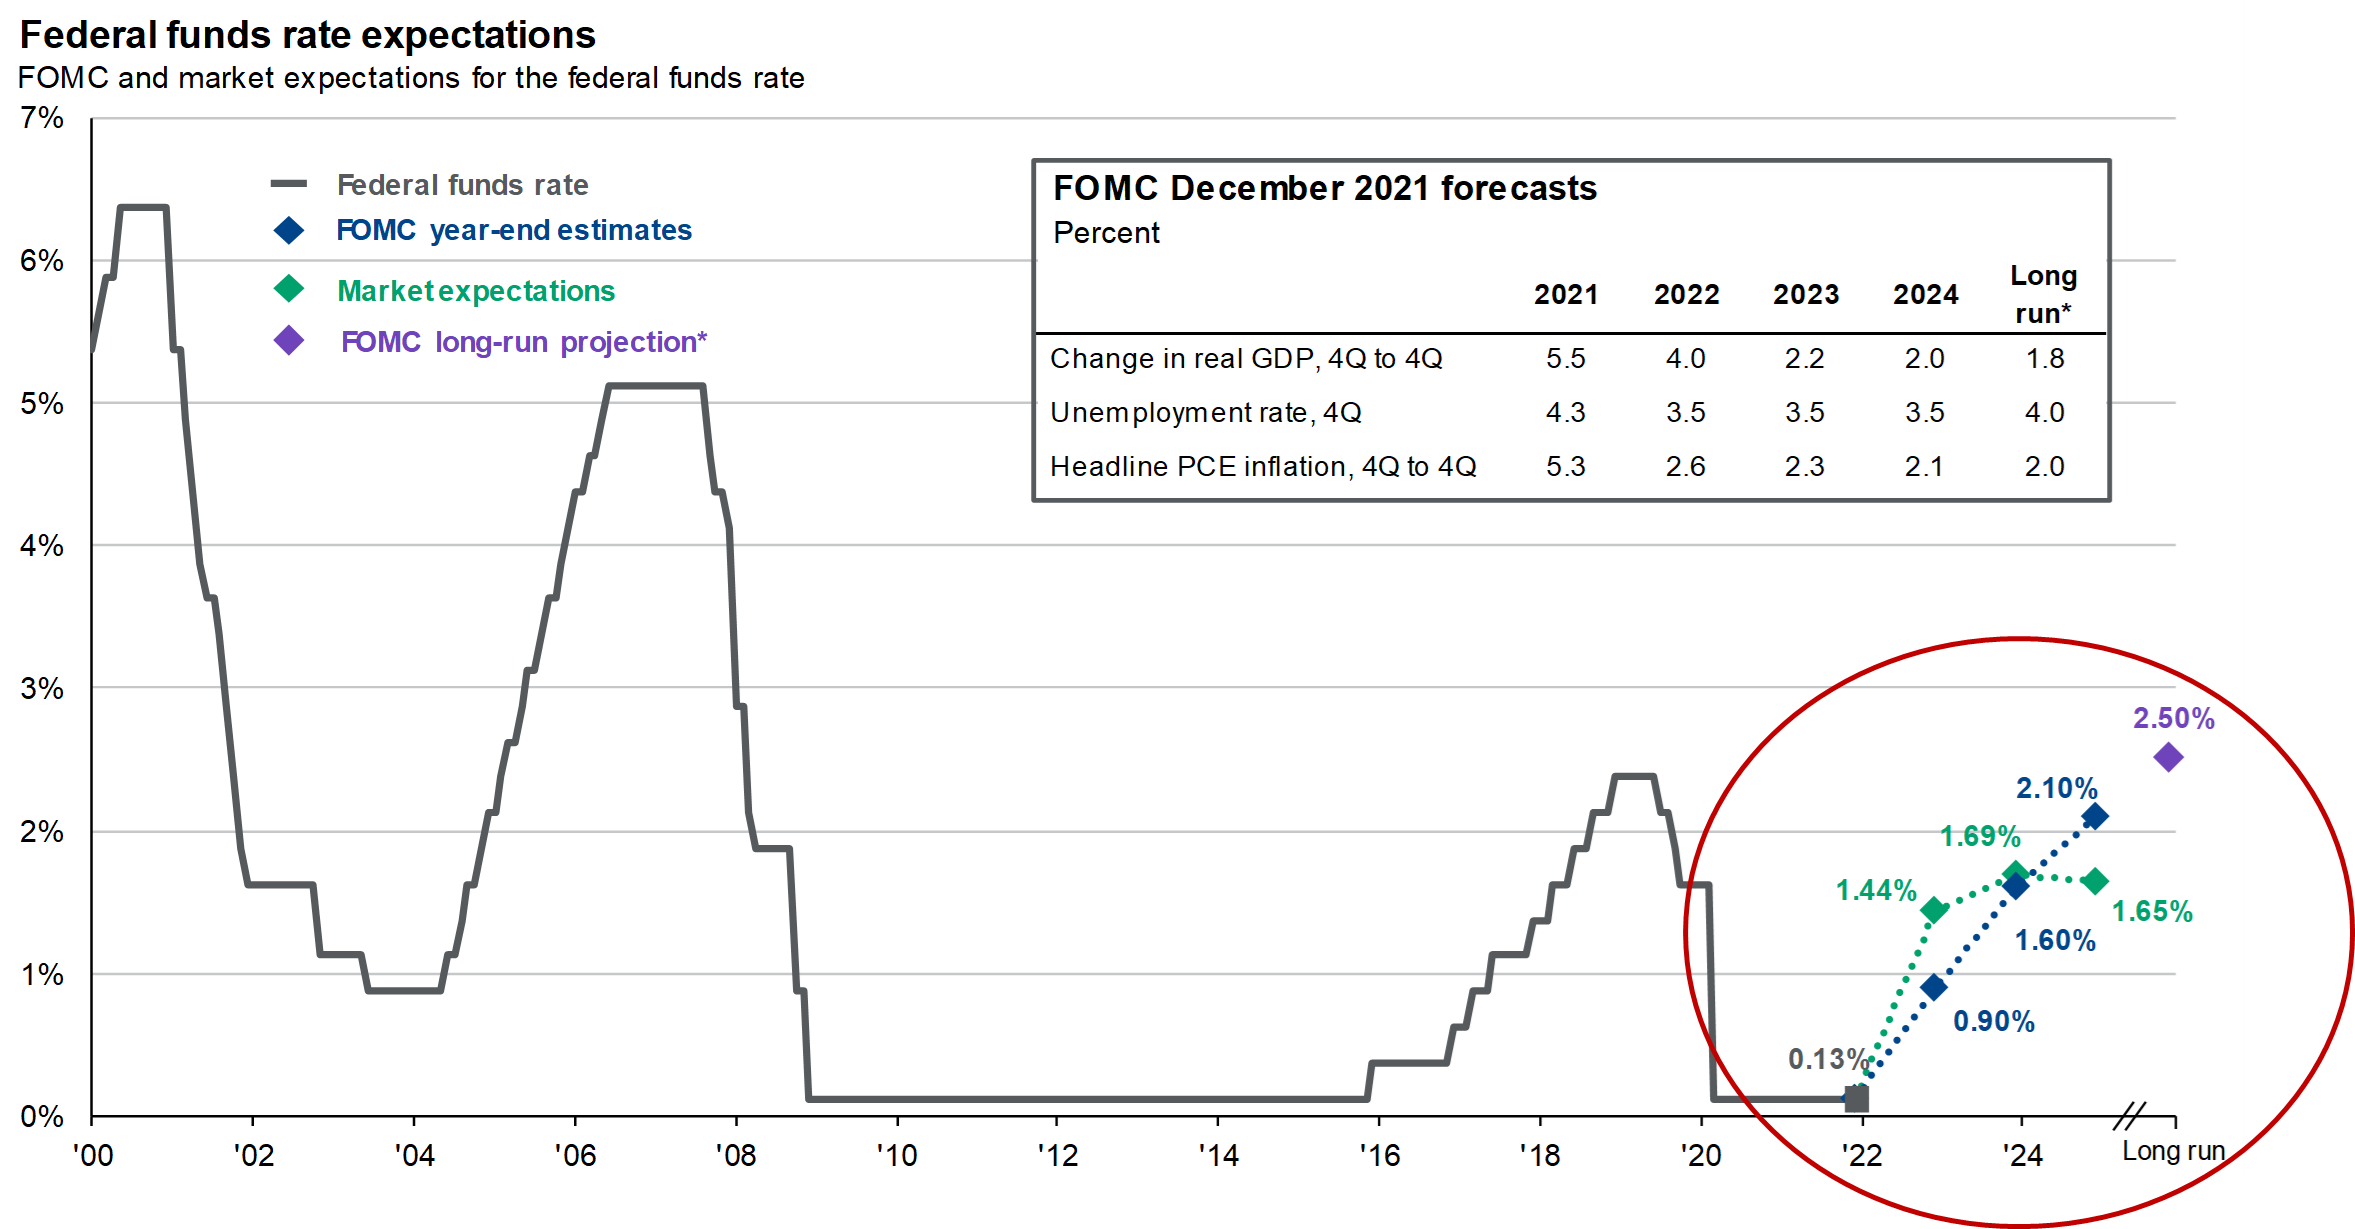
The Federal Reserve has begun communicating a path toward normalizing monetary policy (blue dots below), but market expectations for that path are meaningfully different (green dots). The Fed hopes to increase interest rates in a linear fashion over the next 2-3 years, while market prices imply that investors expect a much swifter normalization of monetary policy followed by a multi-year pause, potentially driven by expectations for a future (Fed induced?) recession. The swifter expectations for interest rate increases imply that market participations, on average, believe that the Fed is “behind the curve” with respect to inflation, and will be forced to normalize policy faster than desired in order to tamp it down. This dynamic, while it may appear subtle in the chart below, is likely a significant contributor to the stock market declines in January, particularly for growth stocks. We believe that inflation will moderate in 2022 as pandemic imbalances ease, fiscal stimulus is no longer a factor, and energy prices stabilize. This will give the Fed cover to raise interest rates along their desired path and should alleviate pressure on markets and interest rate sensitive investments.
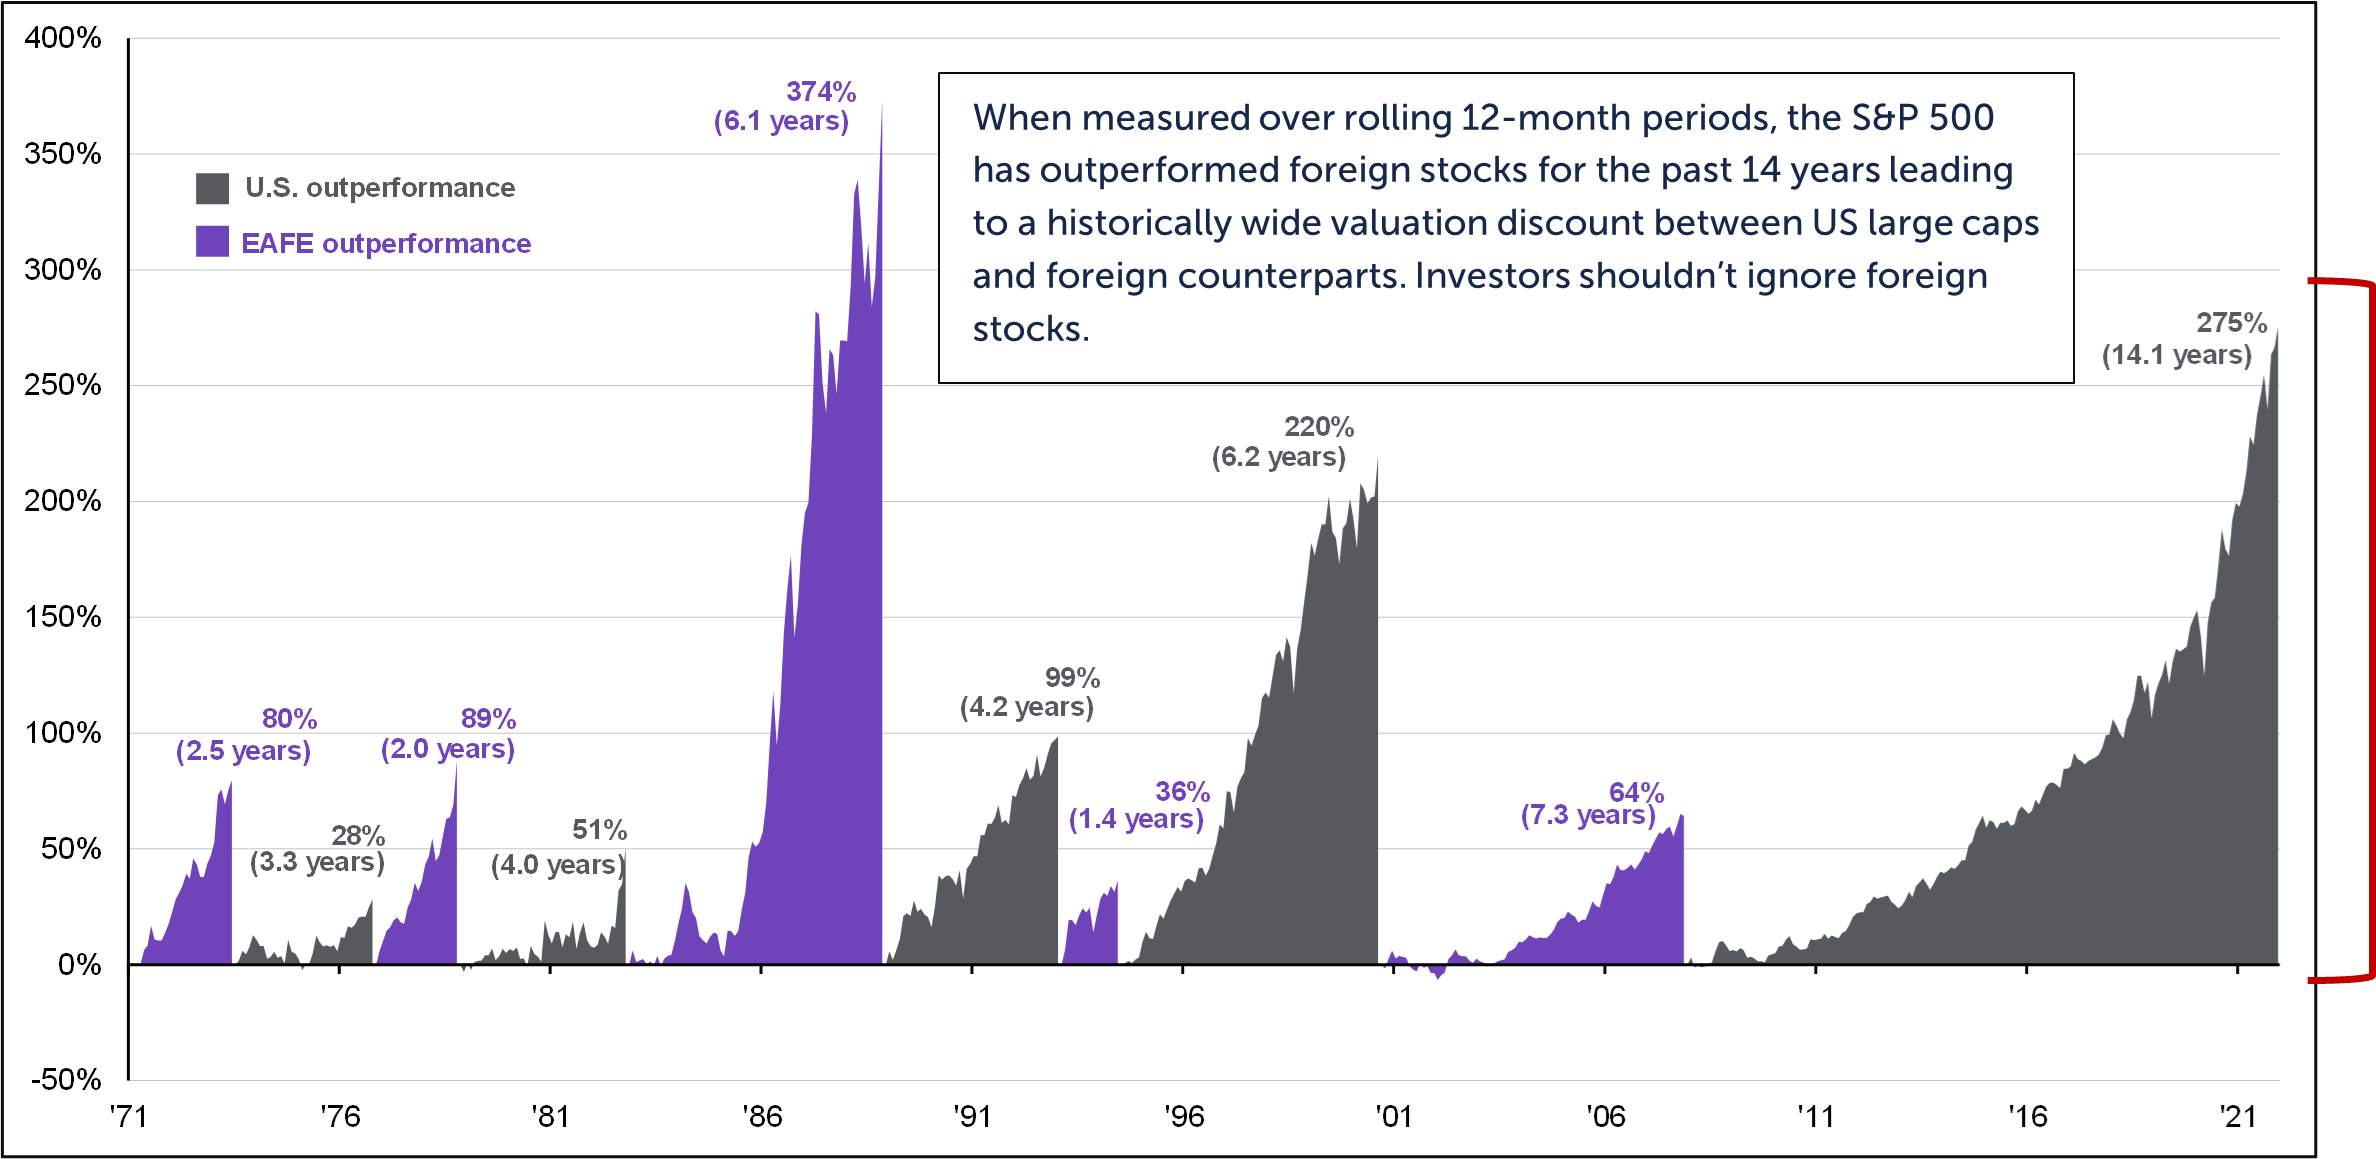
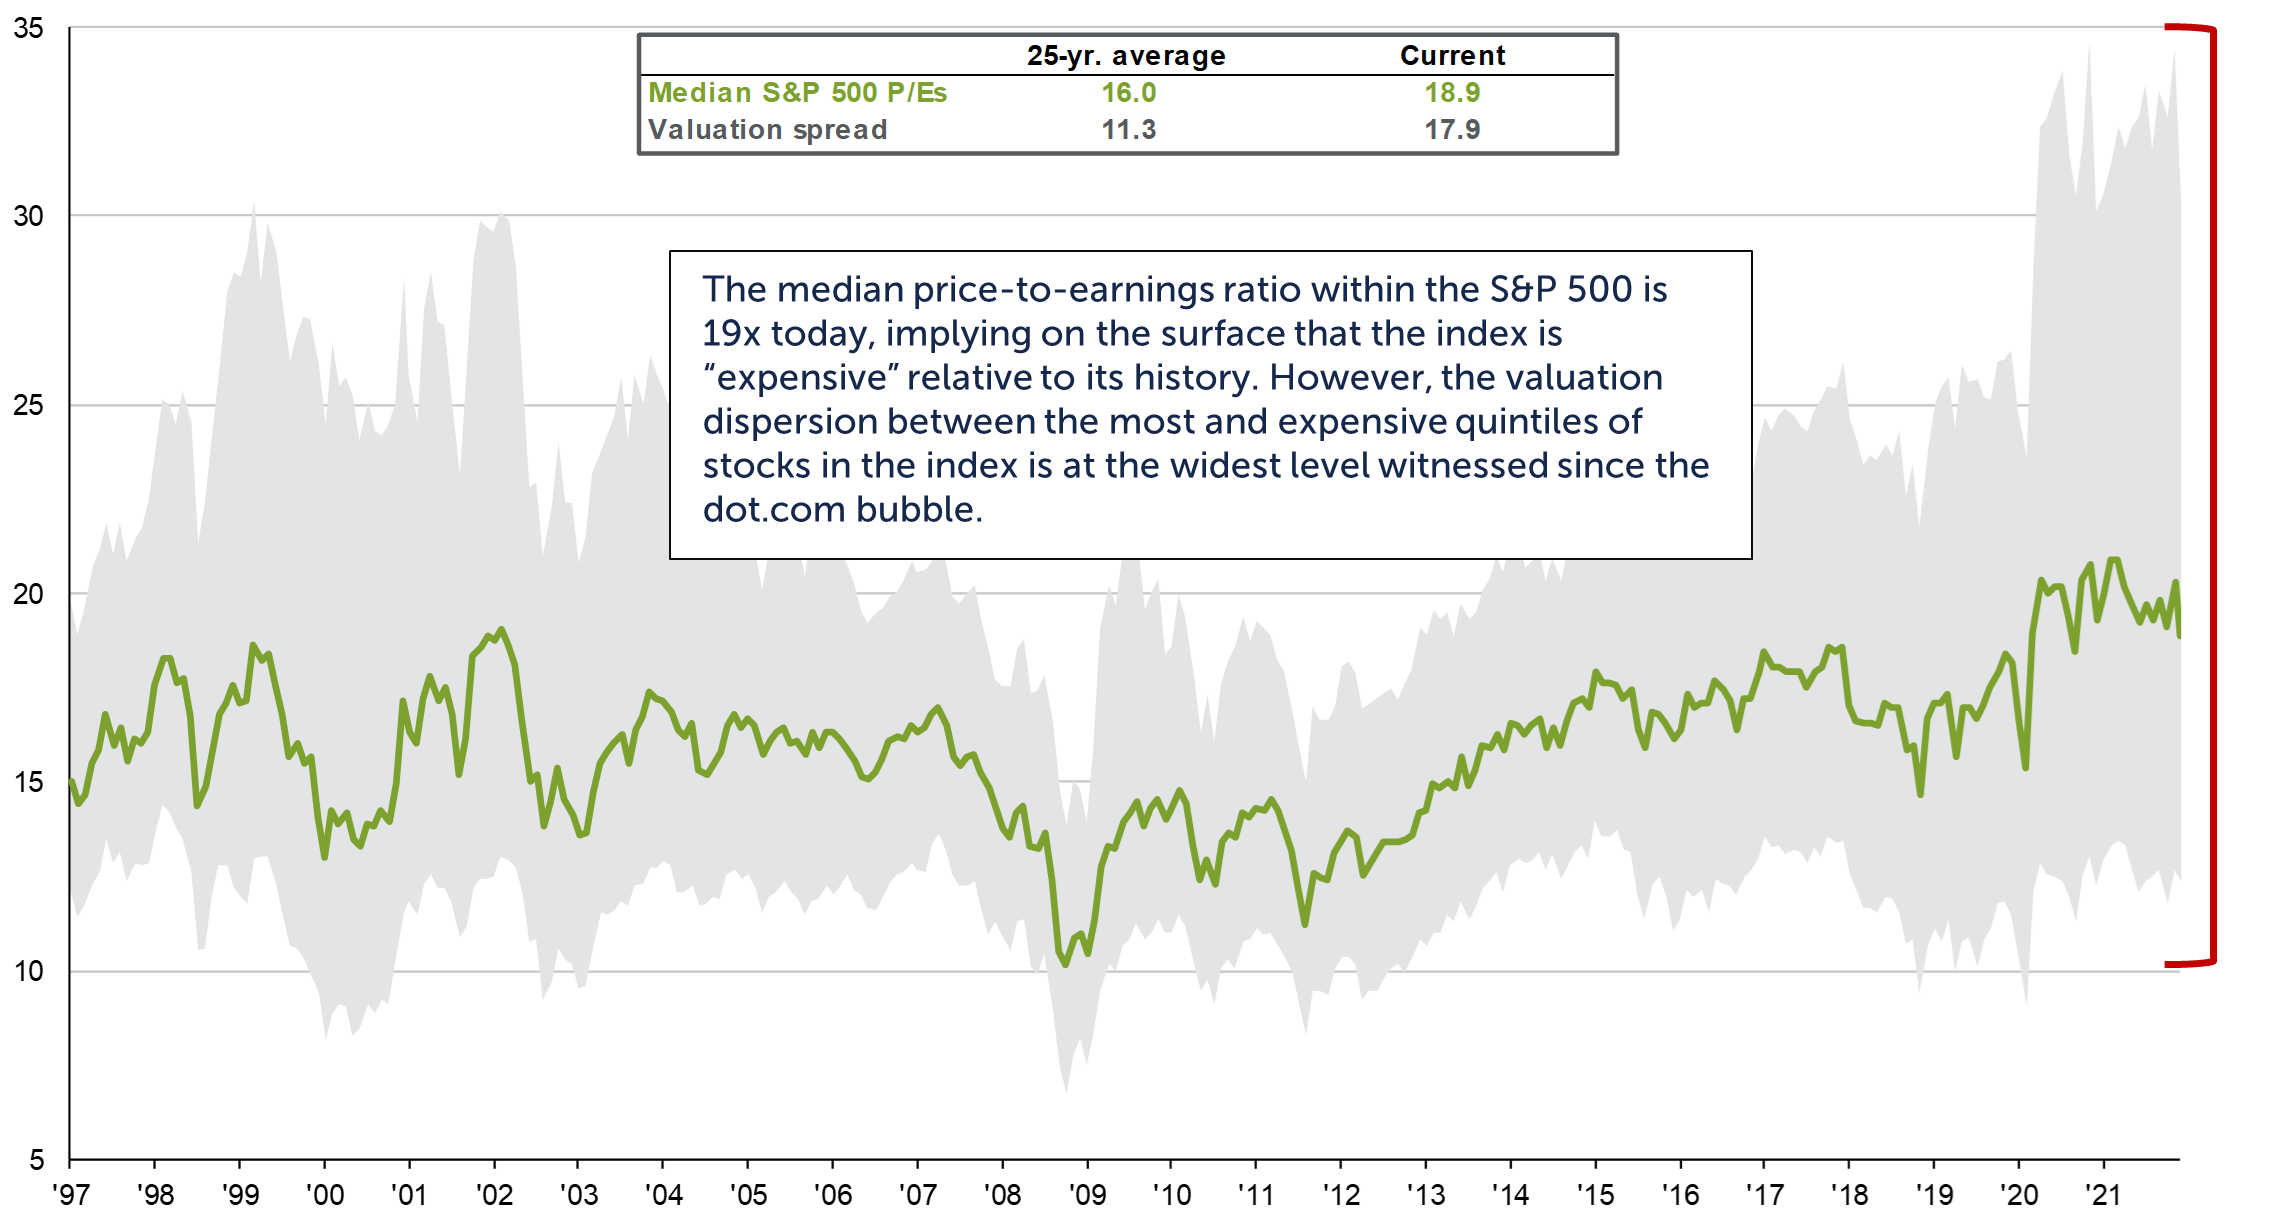
The dispersion between the highest and lowest priced stocks in the market is at levels not seen since the dot.com bubble around the year 2000. We have been increasing shifting toward active managers and lower priced parts of the market that are expected to have a better opportunity to outperform the broad market going forward.
Prices & Interest Rates
| Representative Index | January 2022 | Year-End 2021 | Year-End 2020 |
|---|---|---|---|
| Crude Oil (US WTI) | $88.15 | $75.21 | $48.52 |
| Gold | $1,795 | $1,828 | $1,893 |
| US Dollar | 96.54 | 95.97 | 89.94 |
| 2 Year Treasury | 1.18% | 0.73% | 0.13% |
| 10 Year Treasury | 1.82% | 1.52% | 1.93% |
| 30 Year Treasury | 2.14% | 1.90% | 1.65% |
| Source: Morningstar, YCharts, and US Treasury as of January 31, 2022 |
Asset Class Returns
| Category | Representative Index | January 2022 | Full Year 2021 |
|---|---|---|---|
| Global Equity | MSCI All-Country World | -4.9% | 18.5% |
| Global Equity | MSCI All-Country World ESG Leaders | -5.4% | 20.8% |
| US Large Cap Equity | S&P 500 | -5.2% | 28.7% |
| US Large Cap Equity | Dow Jones Industrial Average | -3.2% | 21.0% |
| US All Cap Equity | Russell 3000 Growth | -8.9% | 25.9% |
| US All Cap Equity | Russell 3000 Value | -2.6% | 25.4% |
| US Small Cap Equity | Russell 2000 | -9.6% | 14.8% |
| Foreign Developed Equity | MSCI EAFE | -4.8% | 11.3% |
| Emerging Market Equity | MSCI Emerging Markets | -1.9% | -2.5% |
| US Fixed Income | Bloomberg Barclays Municipal Bond | -2.7% | 1.5% |
| US Fixed Income | Bloomberg Barclays US Agg Bond | -2.2% | -1.5% |
| Global Fixed Income | Bloomberg Barclays Global Agg. Bond | -2.1% | -4.7% |
| Source: YCharts as of January 31, 2022 | |||
[1] Source: Bloomberg
[2] Source: Morningstar
Download PDF Version
Past performance may not be representative of future results. All investments are subject to loss. Forecasts regarding the market or economy are subject to a wide range of possible outcomes. The views presented in this market update may prove to be inaccurate for a variety of factors. These views are as of the date listed above and are subject to change based on changes in fundamental economic or market-related data. Please contact your Financial Advisor in order to complete an updated risk assessment to ensure that your investment allocation is appropriate.