

May 13, 2022 •Nathan Willis

During our most recent Quarterly Market Update, we discussed the fact that accelerating inflation expectations combined with high valuations led stocks to selloff in the first quarter. This was felt more harshly by growth sectors like technology. Like birthday cake, a bit of inflation is just fine – but just like too many slices of cake cause a stomachache, too much inflation has made the market queasy. We have talked for some time about how the market has been expensive, but that doesn’t usually matter too much in the short term; prices paid today generally affect returns over the next few years, not the next few weeks.
Sometimes, though, valuation matters greatly in the short term. Right now, we are in such a period, so let’s think about:
- What has happened this year
- What has driven the markets
- Any patterns we might glean from history
We’ll also share:
- Our outlook
- What we’re doing in our portfolios
- Our thoughts about what investors should – and shouldn’t – do
Fears of Inflation Turn to Fears of Recession
In the first four months of 2022 we experienced robust core economic growth, corporate profits, and employment. However, we also saw inflation expectations increase, which was the catalyst for expensive stocks to begin to lose value; the fear of a higher inflation caused discount rates for their future profit growth to increase. As the Fed convinced the markets that it was and is committed to fighting inflation, the worry has evolved. The market now worries more that the Fed will commit a “policy error” by raising rates to a level that will drive the economy into recession.
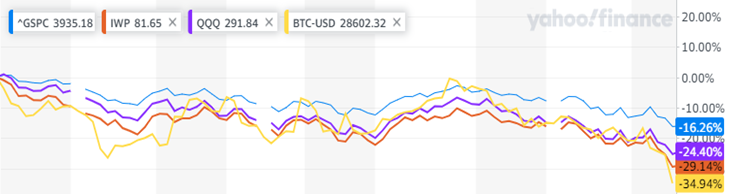
This has caused significant volatility in the markets. While the blue line of the S&P 500 in the chart above shows that it is down 16%, the technology-laden NASDAQ (purple, down 29%) and growth stocks (red, down 24%) are in bear market territory. Speculative assets such as Bitcoin (yellow) are down even more so far this year.
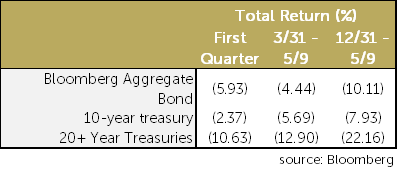 Unfortunately, bonds have not helped either. Rather than acting as a diversifier to stocks, the broad Bloomberg Aggregate index is down over 10% for the year. The real surprise, though, is that bonds maturing in 20 years or more are down almost as much as technology stocks! This is not what we expect, and it reflects the fact that the increase in rates is what has driven valuations down. The market now expects a recession, which may impact cyclical technology shares. The worry has changed, but the result is the same: portfolio losses that are worse than expected based on history. We haven’t seen high stock valuations paired with inflation followed by a recession since the 1970s. That is what the market is worried about today. Are those worries warranted?
 Can the Fed Bake the Inflation Cake?
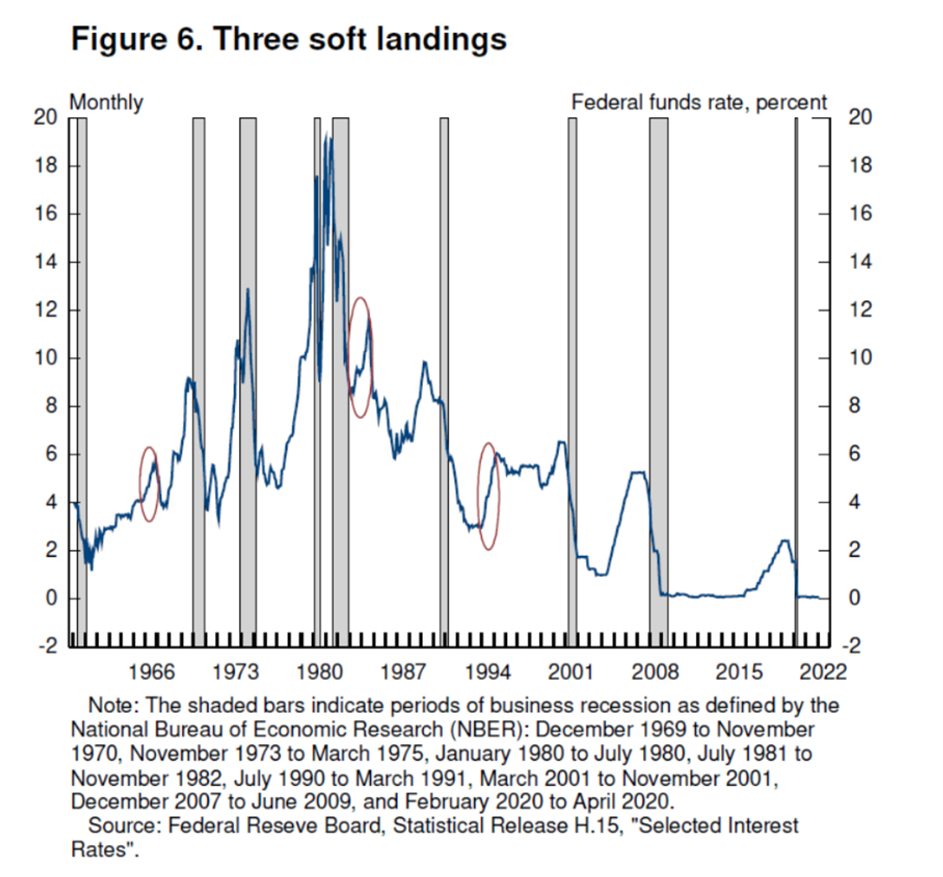
Let’s consider what the Fed is trying to do. As an amateur chef, I am fascinated with Julia Child. When Ms. Child taught Americans to cook a souffle, she made it seem easy (of course), but if you’ve ever tried to cook one, you know success is quite an accomplishment. The same can be said for a soft landing like the Fed is trying to engineer right now. Slowing inflation without bringing on a recession is much more difficult than achieving the height and fluffiness of the perfect souffle – and you don’t get to practice. In fact, Fed governor Powell bragged recently that there were three times in the last 50 years that the Fed did not, in fact, cause a recession when it raised interest rates – those three examples are shown here.[1]
While we don’t know if the Fed will be successful, we can look at market returns after drawdowns like we have experienced and think about what might happen:
- Over the past 40 years, stocks have lost, on average, 14% at some point during the year, but have recovered to end positive 3 out of 4 times.[2]
- There have been 10 times in the last 45 years when the portfolio of 60% stocks and 40% bonds has lost 10% or more over a 4-month period. On average, both stocks and bonds recovered nicely, with bonds and stocks both earning positive returns after the loss.[3]
- Investor sentiment is quite negative by many measures. Looking at the American Association of Individual Investors weekly survey, the bearishness we have experienced over the last few weeks has generally led to positive stock returns over the coming months.[4]
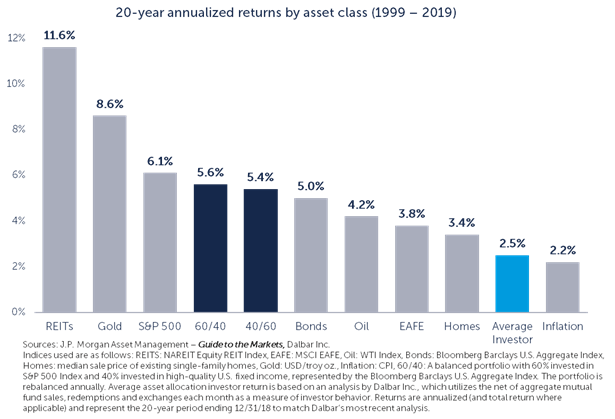
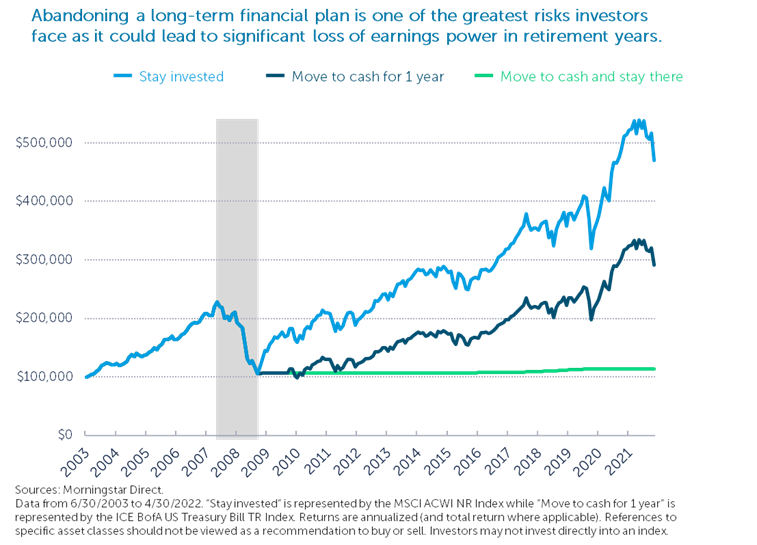 Finally, investors who abandon their discipline and change allocation may expose themselves to the risk that they won’t meet their goals, as illustrated by this graphic. Staying out of the market for even one year can have long term consequences.
Investment Outlook
As we entered 2022, we were expecting the economy and corporate profits to grow, albeit at a lower rate of growth than that of 2021. That view is still intact. What changed was the market’s inflation fears, followed by the fear of a Fed-induced recession, capped off by Russia’s invasion of Ukraine. Allocations to higher priced, growthier sectors have been hurt. Importantly, we have not made significant changes to the manager lineup of the equity portfolio. We have made some minor tactical adjustments, and our underlying managers have repositioned portfolios to take advantage of the opportunities they see in their markets. In the fixed income portion of the portfolios, we have made some adjustments. We shifted the portfolio slightly shorter-term bonds to be less exposed to interest rate risk and more exposed to corporate bonds. Additionally, we are excited about our new fixed income relationship: Nuveen, a TIAA company, now manages the bulk of your fixed income exposure in a strategy that focuses on making a positive impact that is both direct and measurable.
 Maintaining Discipline
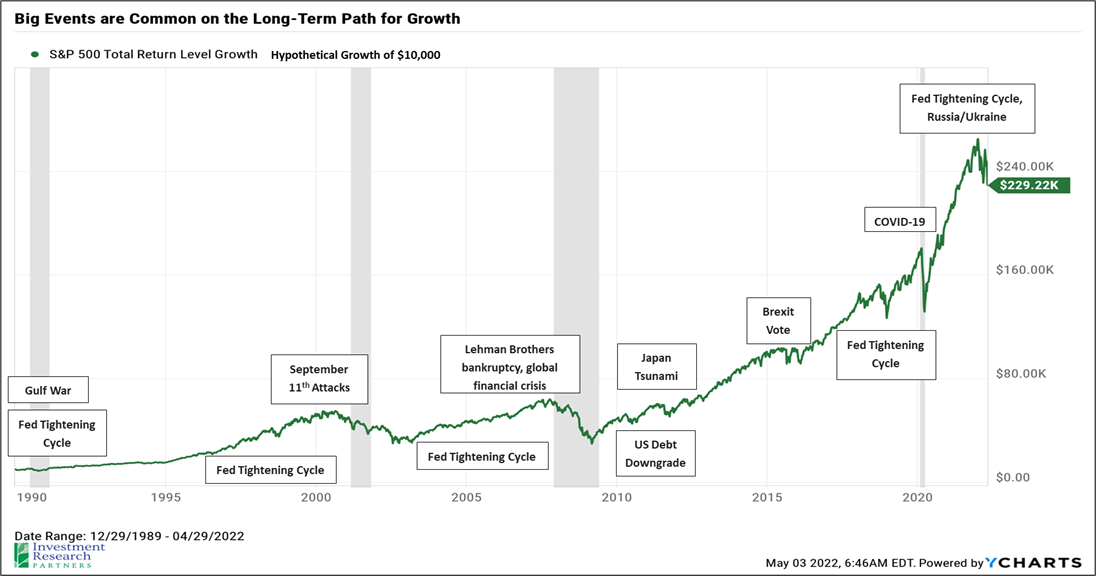
Avoiding mistakes is the key to winning long-term with your investment portfolio. We urge investors to maintain discipline to their plan, which allows the greatest chance of success. We often show this chart on the left that illustrates that the average investor’s investment returns are below almost all the asset classes they invest in and significantly below a hypothetical balanced portfolio. We would also draw your attention to the below chart, which shows various macroeconomic events within the historical perspective of the growth of the stock market. We encourage investors to resist making drastic allocation changes; follow the plan and maintain the allocation that is appropriate.
Julia Child said that cooking is best done with friends; we believe that investing is best done with your advisor. Maintaining your advisory relationship can improve your outcome and make you a better investor. Finally, remember the long-term perspective. This chart shows the Macroeconomic events that tend to fade into the background over time.
[1] Source: Federal Reserve Speech by Chair Pro Tempore Powell on restoring price stability - Federal Reserve Board
[2] Sources: Morningstar, OneAscent Investment Solutions. Returns are based on price index only and do not include dividends. Intra-year drops refer to the largest market drops from a peak to a trough during the year. For illustrative purposes only. Returns are calendar year returns from 1982 to 2021, over which time period the average annual return was 10.8%. Data as of 4/30/2022.
[3] Source: Bespoke Investment Group
[4] Source: American Association of Individual Investors Survey AAII Investor Sentiment Survey | AAII
Past performance may not be indicative of future results. Therefore, no current or prospective client should assume that the future performance of any specific investment, investment strategy (including the investments and/or investment strategies recommended by the adviser), will be profitable or equal to past performance levels.
This material is intended to be educational in nature, and not as a recommendation of any particular strategy, approach, product or concept for any particular advisor or client. These materials are not intended as any form of substitute for individualized investment advice. The discussion is general in nature, and therefore not intended to recommend or endorse any asset class, security, or technical aspect of any security for the purpose of allowing a reader to use the approach on their own. Before participating in any investment program or making any investment, clients as well as all other readers are encouraged to consult with their own professional advisers, including investment advisers and tax advisors. OneAscent can assist in determining a suitable investment approach for a given individual, which may or may not closely resemble the strategies outlined herein.
Any charts, graphs, or visual aids presented herein are intended to demonstrate concepts more fully discussed in the text of this brochure, and which cannot be fully explained without the assistance of a professional from OneAscent. Readers should not in any way interpret these visual aids as a device with which to ascertain investment decisions or an investment approach. Only your professional adviser should interpret this information.