

January 25, 2022 •Nathan Willis
Interviewer: What’s your prediction for the fight? Clubber Lang: My prediction?
Interviewer: Yes, your prediction. Clubber Lang: …Pain!
Rocky III, United Artists, 1982
Robin McCall: I think the important thing is not to make it look like we're panicking.
President Andrew Shepherd: See, and I think the important thing is actually not to BE panicking.
The American President, Columbia Pictures, 1995
Fun with Movies
I included the first movie quote for two reasons; the first one is historical. I picked a quote from a movie produced in the early ‘80s because that’s the last time we experienced inflation higher than we’re experiencing now. In 1979, inflation (measured by the CPI) was 13.3%, followed by 12.5% and 8.9% in 1980 and 1981, respectively. This is illustrated in the chart below.
In December 2021, the CPI reached 7%, but the Wall Street Journal Economic Forecasting Survey estimates that mid-year 2022 inflation will drop to around 5%. Nevertheless, this forecast is an increase from prior expectations of 2% inflation just over a year ago.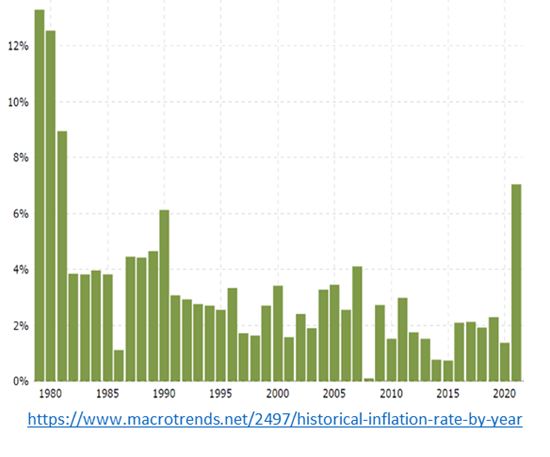
The second reason is theatrical. As Mike Tyson said (continuing boxing analogies), “Everyone has a plan until they get punched in the mouth.” Investors have taken one to the chin so far this year, and this is largely due to concerns that inflation will continue to rise. Fed Governor Powell has stopped referring to inflation as “transitory,” though this was his mantra for several months. Why have increasing inflation expectations hurt stocks? howHow will the Federal Reserve react? And what should investors do now?
Fun with Math
To understand why increased inflation has hurt stocks, we need to think like Wall Street thinks. First, Wall Street analyzes how much money companies will earn both next year and into the distant future, and then it considers the likelihood that companies will meet the Street’s expectations for their earnings. Finally, it discounts those earnings back into a value that determines what the company is worth today. The discount rate is where the math turns ‘fun.’ The only reason you would make a risky investment is the potential to earn more than you would with a risk-free asset (bonds issued by the US Government). So, after thinking about how risky a particular stock is, Wall Street discounts future earnings by Treasury Yields. Compounding the issue is that inflation has found its way into wages, which affect profit margins. While earnings have been exceptionally strong, the growth in earnings is slowing, and wage inflation presents another risk to earnings growth.
While abovethe above analysis is straightforward in theory, in practice it takes a lot of wisdom and discernment. We can improve our decision-making by working with an advisor; we avoid reacting to the emotional ups and downs of the market by maintaining discipline to our long-term plan, having faith that there is more to life than the day-to-day fluctuations in our portfolio.
When the Math Stops Being Fun
This year inflation expectations have increased, and, more importantly, investors have realized that the Fed agrees and is taking inflation very seriously. Bond yields have increased, so the discount rate for growth stocks has increased. And this bigger discount rate equals a lower price for stocks.
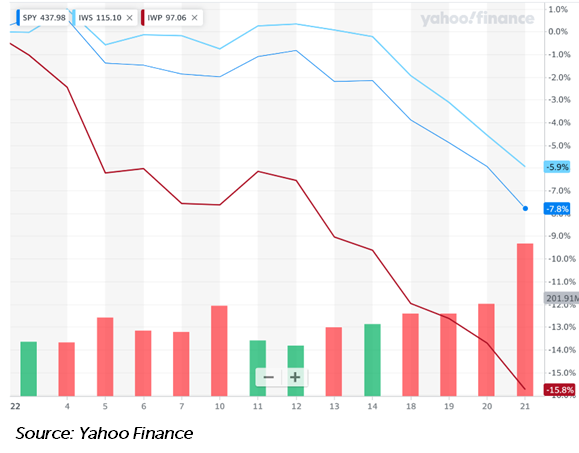 The selloff has been concentrated in the high growth stocks whose valuations have benefitted most from low rates. The chart to the right shows the S&P 500 ETF (SPY), the Russell Midcap Value ETF (IWS, in light blue) and the Russell Midcap Growth ETF (IWP, in red) from December 31, 2021 through Friday, January 21, 2022. As you can see, growth stocks have been hit the hardest this year; this has happened while volume has increased (highlighted by the vertical bars), which means the market is taking this seriously. Market declines have been deeper for growth stocks because their valuations depend more on their future earnings which are expected to grow at a high rate for many years; higher bond yields have hurt their discount rate more than the broad market. The math has not been fun for investors in those stocks.
The prevailing narrative in the financial press is that the Federal Reserve has made a “policy error” by allowing inflation to spike. Rather than wading into that discussion, we need to consider what kinds of economic problems are easier to solve, and what kinds of problems are harder to solve. Deflation, along with a shrinking economy, is a serious problem. The Federal Reserve solution is usually to stimulate the economy by lowering interest rates. To quote the old financial adage, solving deflation is about as difficult as ‘pushing on a string.’ On the other hand, inflation is our present problem, brought about by supply chain shortages, pandemic stimulus, workforce turbulence, and more.
This inflation problem, however, is relatively simple to fix (at least when you are the world’s reserve currency). The Fed simply raises rates, which increases the cost of money, which causes the economy to slow and inflation to come down. Easy, right? Unfortunately, this usually causes the stock market to sell off, which is fairly painful and unpopular. Expect to hear a lot of political pressure on the Fed leading up to the mid-terms!
"New Math" for 2022?
With this framework in mind, what can we expect for the markets and our portfolios in 2022? We don’t expect ‘new’ math, just logical adjustments from 2021:
- First, inflation is likely to remain higher than in prior years, but it should moderate. The Wall Street Journal Economic Survey participants expect inflation to drop to 3% by the end of the year.*
- The International Monetary Fund Predicts Global GDP growth to slow from 5.9% to 4.9% in 2022.**
- WSJ survey respondents expect US GDP to slow from 5.2% in 2020 to 3.3% for the full year 2022. This is a decline, but still a strong result.*
- Corporate Earnings are expected to decline from their 45% gain in 2021 but will likely remain strong.***
- Stocks are likely to be volatile, and bonds—if rates continue to rise—might provide less of a cushion.
- The potential for a "Black Swan," catastrophic event always remains. Black Swan investing episodes are, by definition, both rare and unpredictable. The Coronavirus pandemic was an exceptional example.
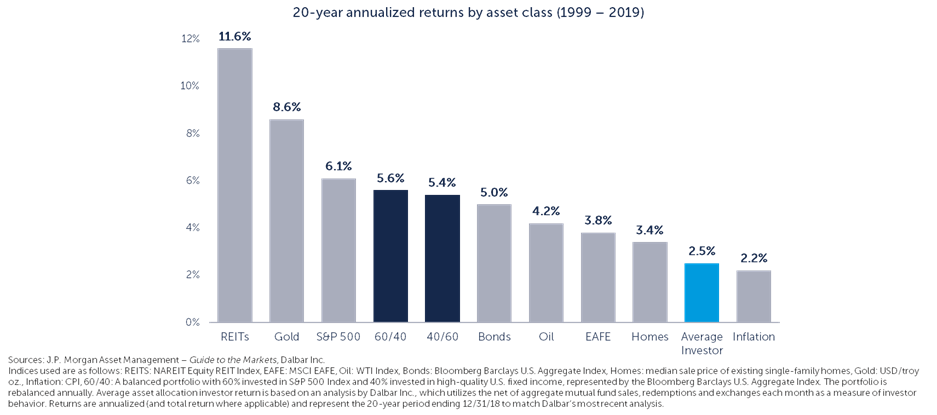
The best way to protect against these kinds of rare events is to maintain your allocation while acknowledging selloffs happen. This will help you to maintain your risk profile, allowing you to take advantage of market volatility by rebalancing. We often refer to this graphic that shows the average investor underperforming most asset classes. The best way to improve your performance is to maintain discipline. OneAscent remains focused on helping you do just that.
I will finish by referring to our second movie quote: “The important thing is actually not to BE panicking.” Even if we experience volatility, we won’t panic, and neither should you. We continue to watch the fundamentals closely, managing investments based upon what we are seeing in the market while maintaining discipline in our portfolios. As we highlighted in our Quarterly Market Update, our committed allocation to international stocks and high-yield bonds has combatted portfolio volatility as tech stocks continue to waver. If you have questions or concerns about your portfolio, we encourage you to talk with your advisor.
* Source: Wall Street Journal economic forecasting survey
About The Wall Street Journal Economic Forecasting Survey - WSJ
** Source: IMF World Economic Outlook
World Economic Outlook, October 2021: Recovery During A Pandemic (imf.org)
*** Source: Factset https://www.factset.com/hubfs/Website/Resources Section/Research Desk/Earnings Insight/EarningsInsight_011322A.pdf?hsCtaTracking=31d0f488-5c02-4193-b93b-f1708067f4fa%7Cb994622e-6b82-4c98-ad34-76c848088314 (p9)
Past performance may not be indicative of future results. Therefore, no current or prospective client should assume that the future performance of any specific investment, investment strategy (including the investments and/or investment strategies recommended by the adviser), will be profitable or equal to past performance levels.
This material is intended to be educational in nature, and not as a recommendation of any particular strategy, approach, product or concept for any particular advisor or client. These materials are not intended as any form of substitute for individualized investment advice. The discussion is general in nature, and therefore not intended to recommend or endorse any asset class, security, or technical aspect of any security for the purpose of allowing a reader to use the approach on their own. Before participating in any investment program or making any investment, clients as well as all other readers are encouraged to consult with their own professional advisers, including investment advisers and tax advisors. OneAscent can assist in determining a suitable investment approach for a given individual, which may or may not closely resemble the strategies outlined herein.
Any charts, graphs, or visual aids presented herein are intended to demonstrate concepts more fully discussed in the text of this brochure, and which cannot be fully explained without the assistance of a professional from OneAscent. Readers should not in any way interpret these visual aids as a device with which to ascertain investment decisions or an investment approach. Only your professional adviser should interpret this information.