

October 3, 2022 •Nathan Willis

Avalanche Prevention
Skiers often hear explosions during their morning preparation as the resorts trigger mini avalanches up on the mountain. The avalanche team seeks out unstable snow and triggers small snow landslides; this clears out the suspect snowpack and hopefully prevents a life-threatening avalanche. The process is very scientific, but not always exact.
This is like what the Federal Reserve is trying to do. The source of instability today is inflation, and their landslides consists of steady increases in interest rates that will hopefully prevent an all-out avalanche. If the Fed triggers the landslide before the instabilities are too great, then maybe they can keep the big one from crashing down the mountain. Unfortunately, this, too, is an inexact science. We know unemployment will go up as rates rise, but we don’t know exactly how many people will lose their jobs. We know the economy will cool, but we don’t know how much, and we can’t be sure how much companies’ earnings will slow.
Regardless, the Federal Reserve is committed to their form of avalanche control. Inspired by September’s inflation data, the Fed affirmed their commitment to bringing inflation under control. The possibility that fight would lead to a growth slowdown, or even an outright recession appears an afterthought. The market is finally convinced that this Fed is hawkish – determined to continue raising interest rates. The goal is noble, but as we saw in September, stock markets usually don’t respond well to hawkish central bankers!
The escalation of Russia’s offensive in Ukraine andpolitical upheaval in both the UK and Italy have exacerbated the Fed’s actions into a lethal combination of negative macro data. This led to some of the lowest investor sentiment we have experienced since the global financial crisis. September indeed felt like an avalanche of bad news, and the slide back towards the summer lows left invstors disoriented.
September Market Review
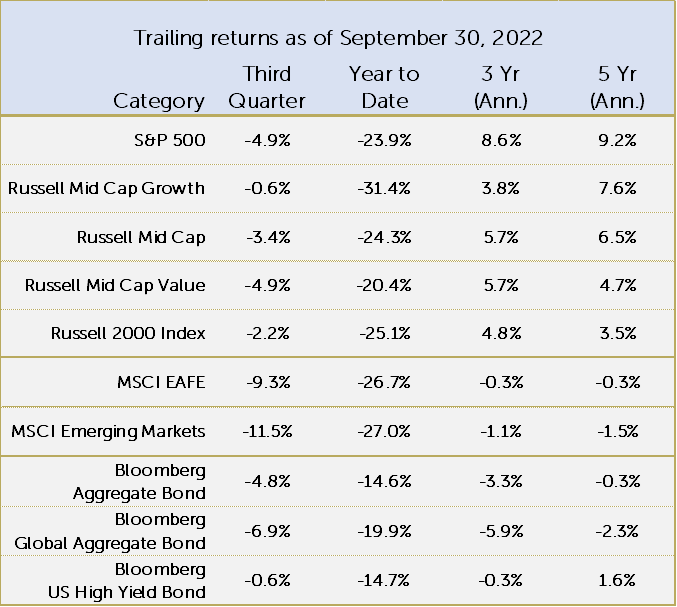 The S&P 500 declined 9.2% during the month, back to the lows of mid-June. Reflecting the negative sentiment toward riskier assets, small cap and international stocks sold off more than the large US stocks. Emerging markets was the worst stock category for the quarter and YTD period. Bonds continue to disappoint as a diversifying asset class.”
This selloff is different from what we’ve come to expect. This year the action in the bond market has caused the sell-off in stocks. In other words, the interest rate hikes leave stock investment without the safe haven of bond diversification. In September, the Bloomberg Aggregate Bond Index sold off 4.3%, and high-yield bonds sold off almost 4%. Interestingly, high-yield bonds have performed about the same as higher quality bonds this year; both groups are down a bit less than 15%. Normally we would expect high-yield bonds to sell off as recession risks increase, but the bond market doesn’t seem worried about corporate bankruptcies. Poor stock and bond performance have caused a 60/40 balanced portfolio to have its worst start since 1974.[1] A big driver of this is the bond market performance which is experiencing its worst 9-month period since inception of the Bloomberg Aggregate Index. The next worse 9-month period was in 1980, down 12.6%. Other than 1980, there hadn’t been another 9-month period with returns worse than 5 percent until this year.[2]
Bonds have led the market selloff because of the spike in inflation expectations. The increase in inflation expectations caused bond yields to rise. With inflation higher, we need to earn higher interest to buy things when we get our bond coupons, which caused prices to go down.
The higher yields have another effect that we haven’t had to think much about for 40 years: Bond yields are a major factor in stock valuations, especially for high growth stocks whose earning potential is in the future. Why is that? If we’re going to take higher risk by investing in stocks, we need to be able to have an apples-to-apples way of comparing that to a government bond, which is considered the ‘risk-free’ asset. 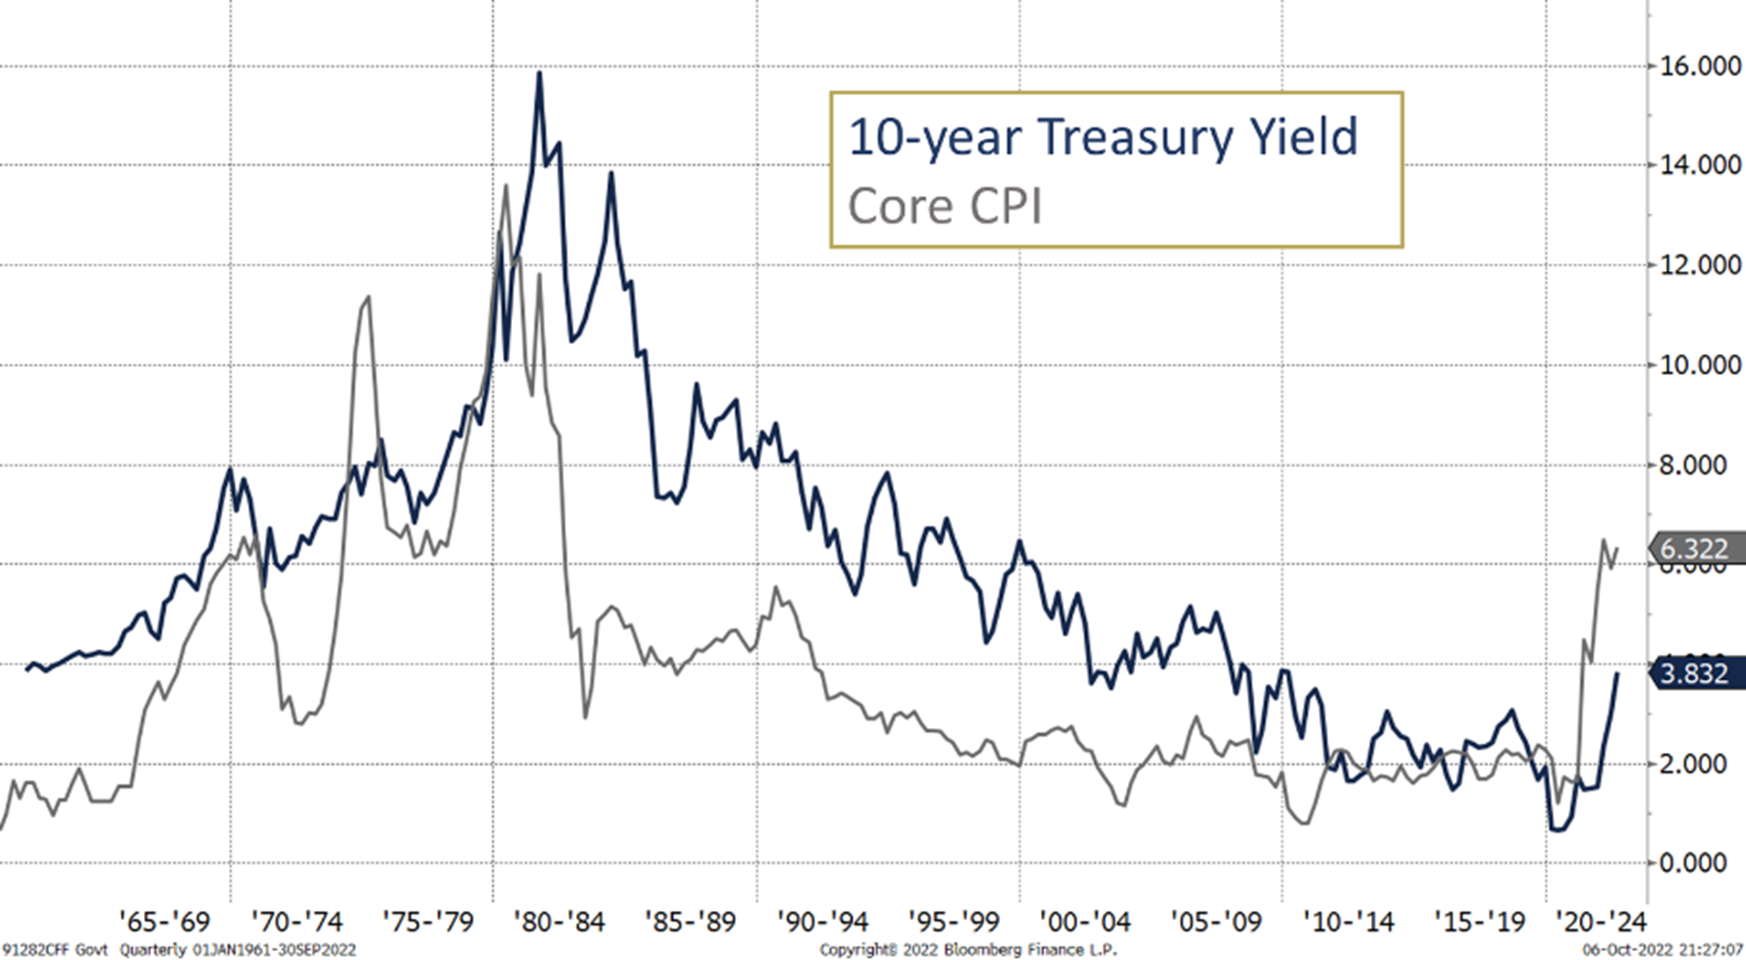 We take those future profits we think stocks will earn and discount them back by the current level of interest rates. Therefore, when rates go up – and, importantly, when the market thinks they’ll stay higher – the values of those stocks drop. This chart of bond yields illustrates the recent change. It shows the ten-year treasury bond yield and the rate of core Consumer Price Index, going back to 1961. Since the 1980s, interest rates have trended downward because inflation, illustrated by Core CPI, has been so low. But now inflation has spiked to levels not seen since the early 1980s, and that has hurt both bond and stock valuations. This leads investors to ask questions:
- What will happen with inflation?
- How will stocks and bonds perform? Won’t bonds lose money over the next few years?
- If we’re going into a recession, should I get out of the markets and sit on the sidelines until things settle down?
Inflation expectations are fundamental to answering these questions. We need to consider why inflation has been so low for so long and why it has spiked so quickly. Inflation has been so low because of some deflationary forces that weren’t in play during the inflationary 1970s:
- Energy Crisis: The oil embargo in 1973 kept prices high. Despite Russia’s war on Ukraine the energy markets are far more liberal, and the US is a much more significant producer than in the 1970s.
- Technology: A tech boom started in the 1980s and has continued, with significant deflationary effects. The Base Apple II model, released in 1977 for $1,300 ($5,900 in 2021 dollars), had 4 kilobytes of memory – not nearly enough to store this article. Today you can buy an iPhone for a few hundred dollars that is orders of magnitude more powerful.
- Demographics: The post WWI population boom led to a significant increase in workers in their high earnings (and spending) years. Today our population has aged, with more population in retirement. This, too, is deflationary.
These factors are all acting to hold inflation down. So why has it spiked? One significant factor has been the huge government stimulus which has come in two forms: fiscal stimulus (instituted by Congress) and monetary stimulus (instituted by the Federal Reserve).
Fiscal stimulus is more straightforward. Trillions of dollars were doled out to individuals and businesses during 2020 and 2021.
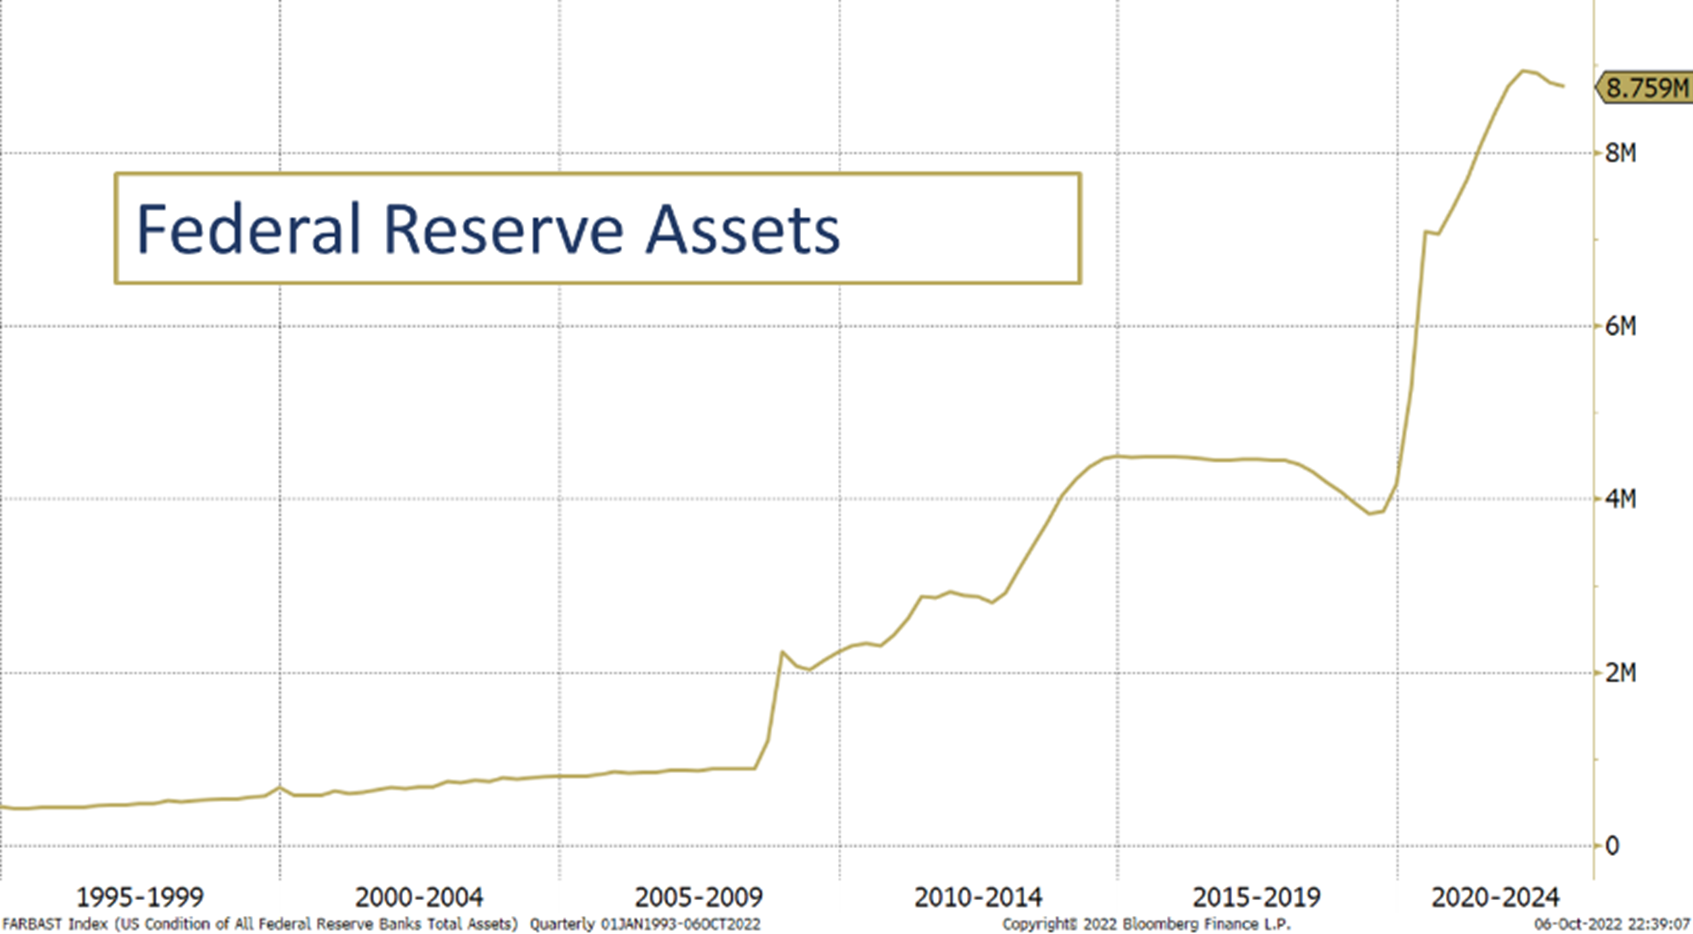 Monetary stimulus is more complex. The Fed uses its balance sheet to help execute its dual mandate of price stability and full employment, sometimes buying or selling securities to help keep the banking system stable. This was normally a sleepy part of what the Fed did, but it became much more significant during and after the financial crisis of 2008. The Fed instituted programs that can collectively be referred to as Quantitative Easing, or QE, where the Federal Reserve created money and used it to buy assets, thereby increasing the money supply. During the 2020 pandemic this practice expanded significantly, as can be seen in the chart of the Fed’s balance sheet. Notice the end of the chart. In the same way the Fiscal stimulus has finished, the Fed is also beginning to shrink its balance sheet through a process described as quantitative tightening (QT) – selling assets to the market and paying back the treasury with the proceeds, reducing the money supply. The Fed has indicated it will continue to unwind its balance sheet.
The termination of the fiscal and monetary stimulus should reduce inflation, and we are beginning to see this in the inflation data. The existence of several deflationary forces that were not in play during the 1970s should also abate future hyperinflation.
Indeed, when looking at the data, inflation may not be the most significant problem we face right now. The possibility of a recession is likely going to be the biggest driver of returns over the next year.
Performance expectations
If we don’t have a recession, the stock market may have seen the worst of this Bear. According to Ned Davis Research, bear markets that occur when the economy is not in recession tend to average a 25% loss. That means we’ve experienced an ‘average’ non-recessionary bear market. Bear markets that are associated with recessions average a 31% drawdown, only a bit worse on average, but with much wider variability. There are several recessionary bear markets when stocks lost roughly half their value and they lost 90% of their value in the depression ending in 1932.
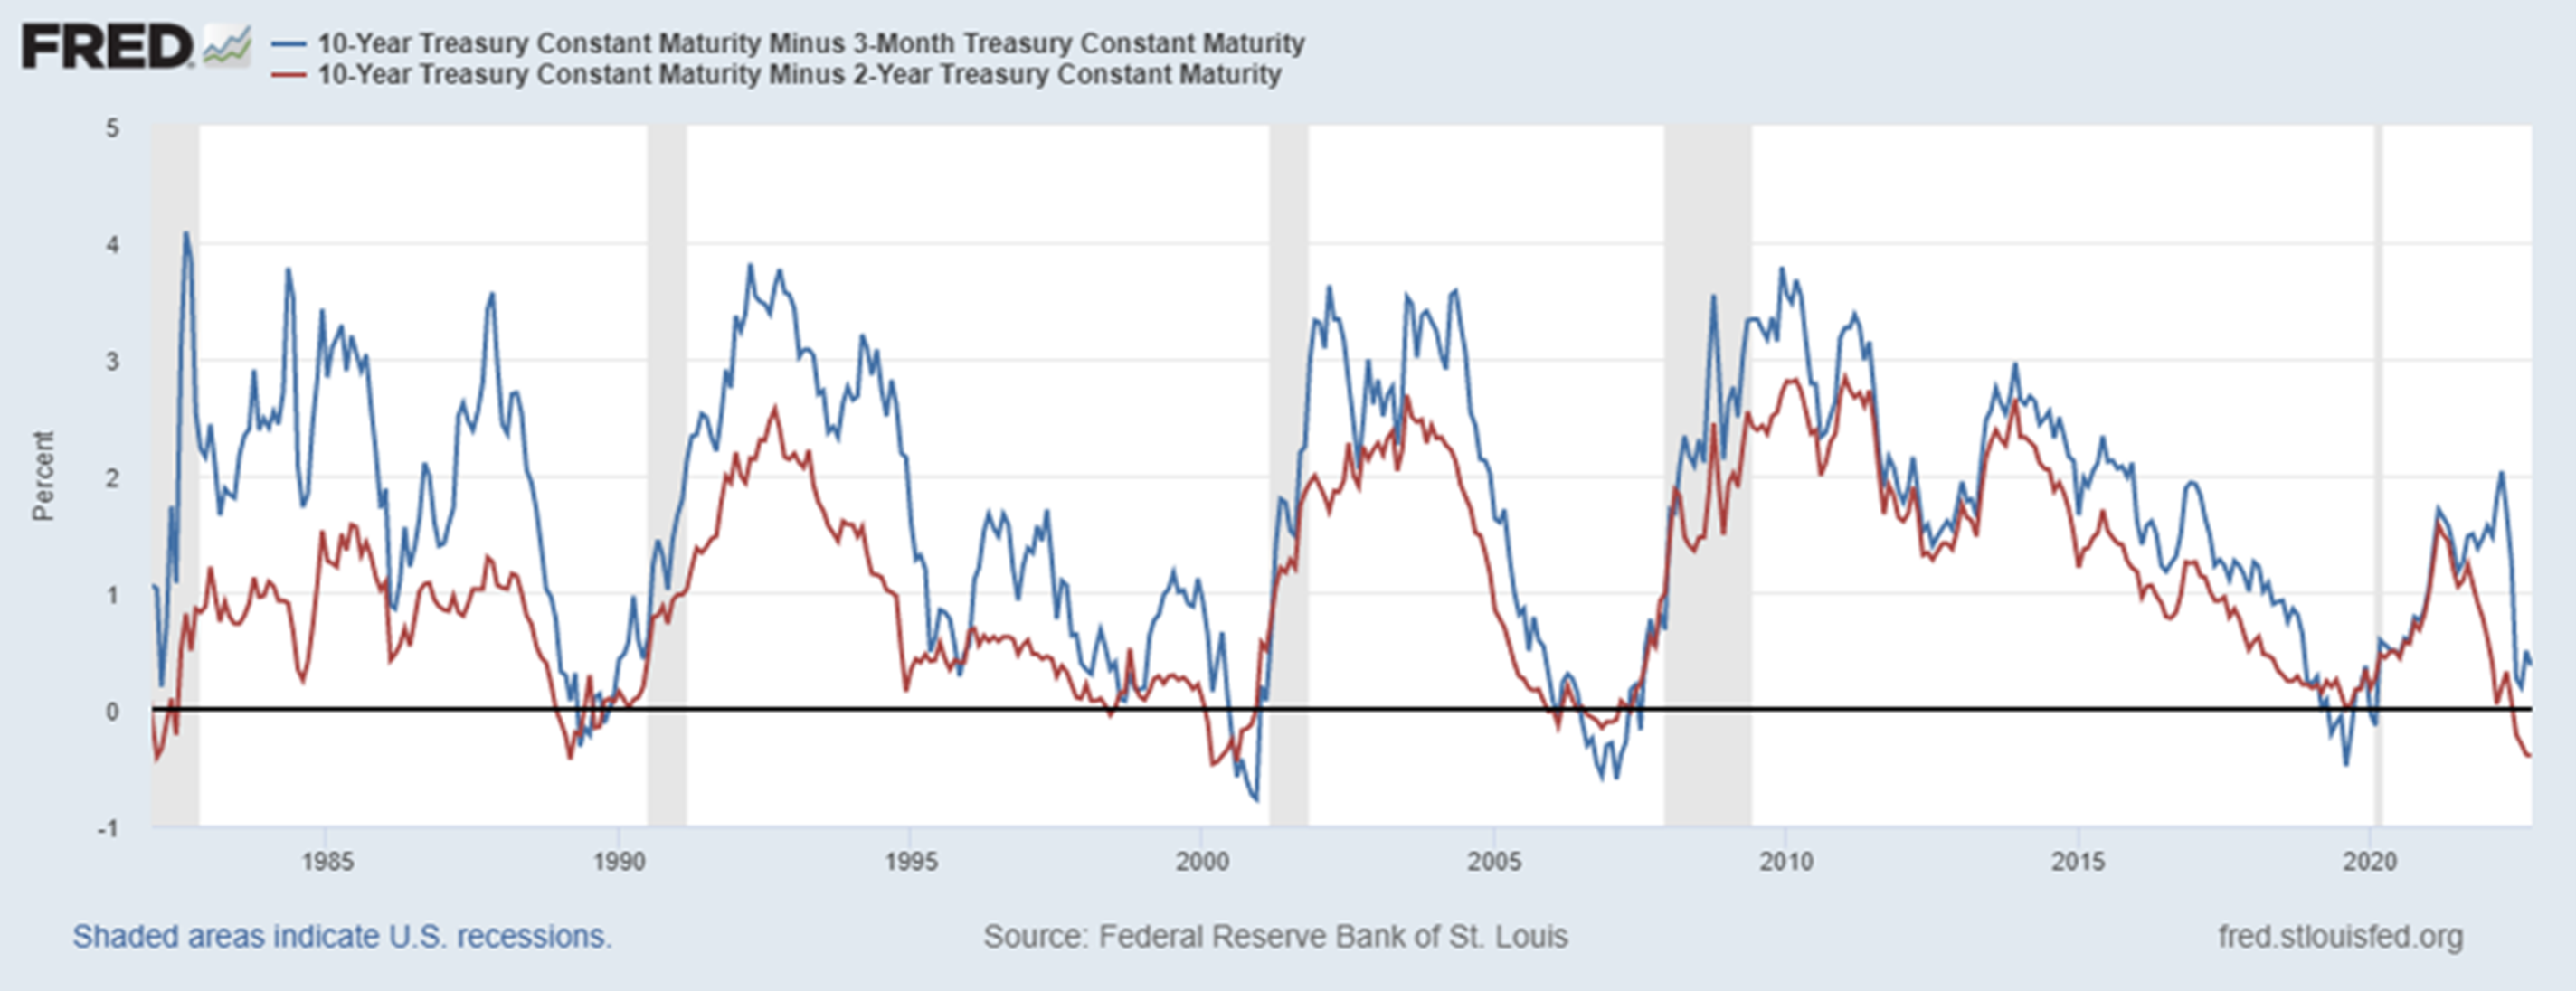 What is the likelihood of a recession? One way to predict recessions is to look at something called the ’yield curve,’ the difference between short-term and longer-term interest rates. When the curve inverts – when longer term rates are lower than short term rates – that suggests that the economy is headed into recession. The market tends to focus on the difference between the 2-year and 10-year yields, highlighted in red in this chart. The Fed, however, focuses on the difference between the 3-month and 10-year yields, in blue. You can see a clear relationship; when both yield curves invert, you’re very likely to have a recession in a few months. In fact, an inverted yield curve has predicted every recession since the 1980s. Today, the market’s preferred yield curve is inverted, but the Fed’s yield curve isn’t. Given the lack of a definitive signal, it’s simply not safe to assume we’ll have a recession and that stocks will sell off further. But economics, like avalanche control, is not an exact science.
Risk of sitting on the sideline
There are lots of reasons to disengage from the market. The Fed could be making a mistake. We might have a recession. Putin might escalate in unprecedented ways. Our political parties are constantly battling one another. And one of my personal favorites, there’s too much volatility, so maybe it’s worth waiting for things to calm down.
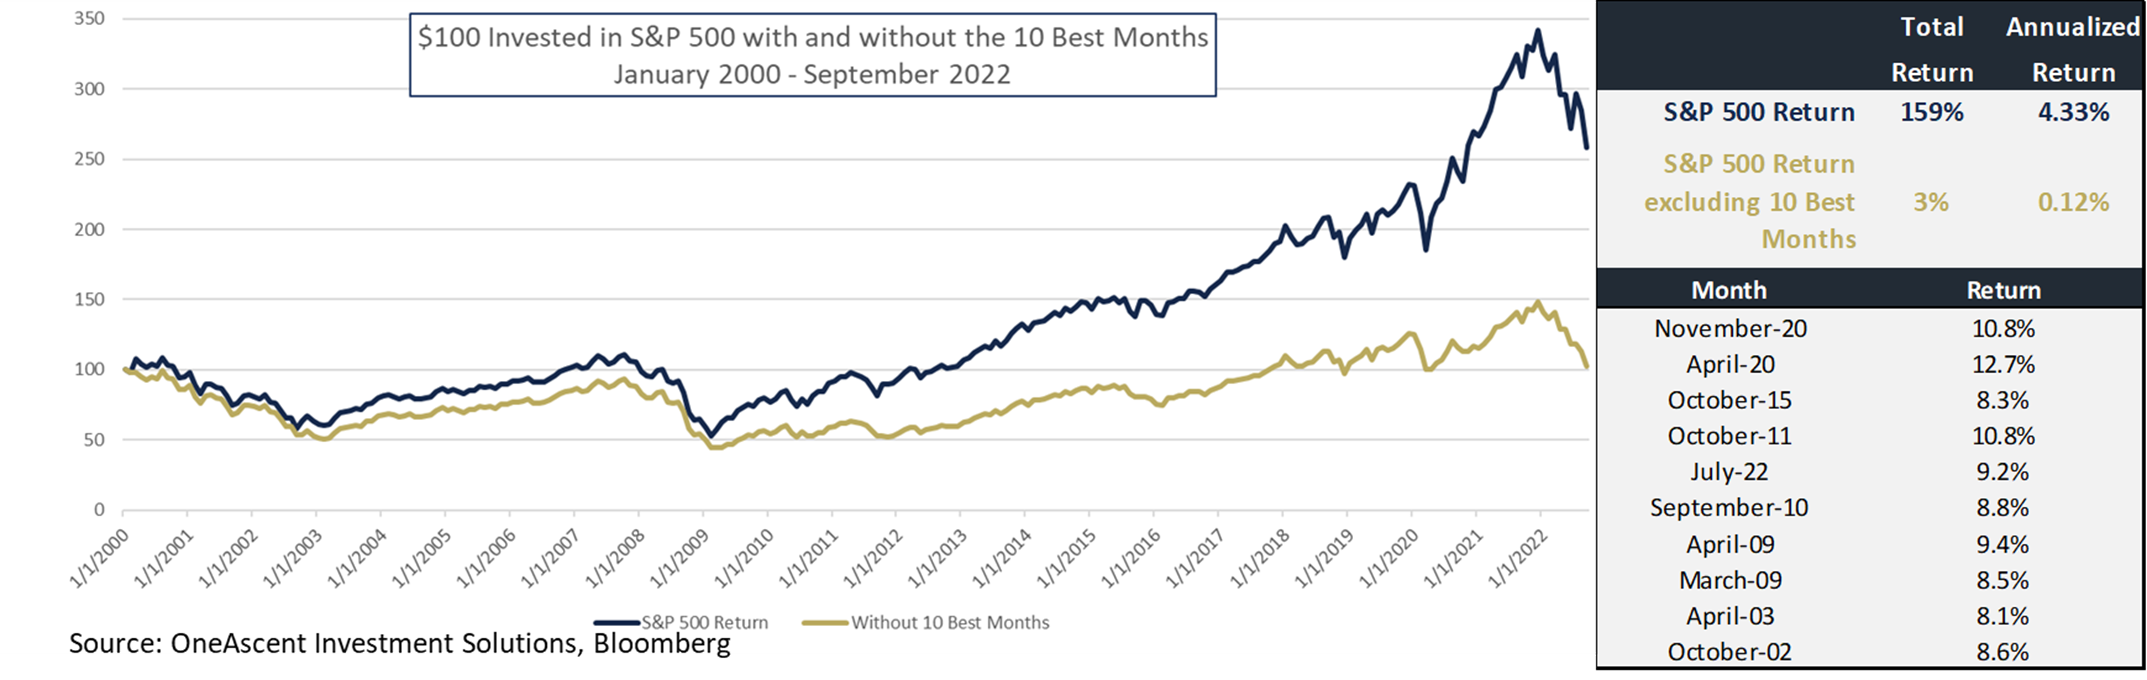
The problem with waiting until the market calms down is that the best months in the stock market often follow the worst ones. This chart shows the returns of the S&P 500 from January 1, 2020, through September 30, 2022. If you invested in 2000 (close to the top of the tech bubble) and held until the end of last month (down 25% from the highs) you would have earned 4.3% annualized return – not great, but even with bad timing you would have made money. What if you missed out on the best 10 months? If you had done that, your return would be a whopping 0.12% annually. Your $100 would have turned into $103 over 22 years!
You would have been far better off staying invested when it felt uncomfortable. For example:
- July 2022: S&P 500 was up 9.2% after the market hit its low for the year
- April 2020: S&P 500 was up 12.7% the first month after the pandemic bear market
- March and April 2009: S&P 500 was up 8.5% and 9.4% the first two months after the lows of the global financial crisis
Our Navigator process, a data-driven review of Valuation, the Economy, Technical, and Sentiment factors, can help us maintain discipline. We have seen a couple of changes in September.
Review of our Navigator Outlook
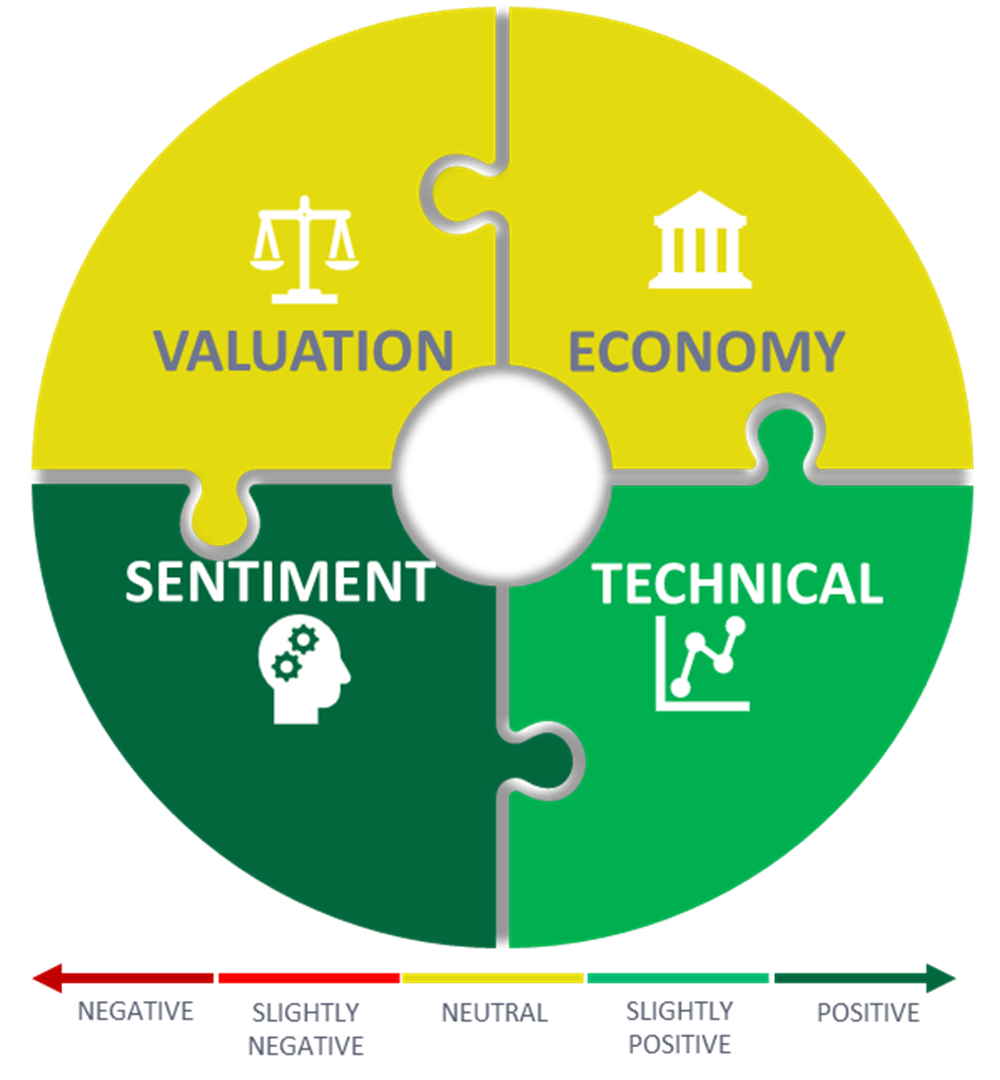 Valuation: Valuation is neutral, as stocks and bonds have become cheaper this year Price to Earnings ratios have gotten lower, and bond yields have increased. The main risk to stock valuations is the stability of corporate earnings.
Economy: The economy is a mixed bag; fears of an overly aggressive Federal Reserve dominate the outlook. Employment is strong, and inflation may have already peaked. We are watching earnings closely, as estimates for the third quarter of 2022 have begun to decline.
Technicals: The stock market became quite oversold at the end of September and, while choppy, the potential for a sharp rally exists. The long-term technicals are not all positive – the Advance/Decline line is still dropping, indicating that more stocks are trading down than trading up. We are watching this and other long-term technical indicators closely to confirm the technical outlook is sound.
Sentiment: Investor sentiment has been very negative all summer, a situation which continues into October. Measures of consumer confidence appear to have recovered some from very negative readings, rendering sentiment very positive.
Portfolio recommendations
In today’s environment maintaining discipline is hard, but incredibly important. We recommend investors take the following actions:
- Consider high yield bonds in the fixed income allocation, as yields are attractive, compensating investors for the risk of recession and increased defaults.
- Consider reducing international equity allocations due to the energy crisis and heightened risk of recession in the Euro area given the continuing war in Ukraine.
- Talk to your adviser about alternative assets, and whether they may be right for you. Alternatives often have low correlation to the traditional markets and have different drivers of return.
Balanced portfolios have experienced the worst 9-month period in decades. However, assets often offer very attractive returns after periods of volatility. Investors may feel disoriented, as if they have been swept away by an avalanche of negative returns. We remind ourselves that the most important aspect of having a plan is sticking to it even when its uncomfortable. Even the best investment strategy has periods of underperformance. We believe a diversified portfolio is a great strategy, and while it hasn’t provided tremendous benefits this year, we remain confident in the value of this approach.
[1] Source: Ned Davis Research
[2] Source: Bloomberg, OneAscent Investment Solutions
Download PDF Version
This material is intended to be educational in nature, and not as a recommendation of any particular strategy, approach, product or concept for any particular advisor or client. These materials are not intended as any form of substitute for individualized investment advice. The discussion is general in nature, and therefore not intended to recommend or endorse any asset class, security, or technical aspect of any security for the purpose of allowing a reader to use the approach on their own. Before participating in any investment program or making any investment, clients as well as all other readers are encouraged to consult with their own professional advisers, including investment advisers and tax advisors. OneAscent can assist in determining a suitable investment approach for a given individual, which may or may not closely resemble the strategies outlined herein.